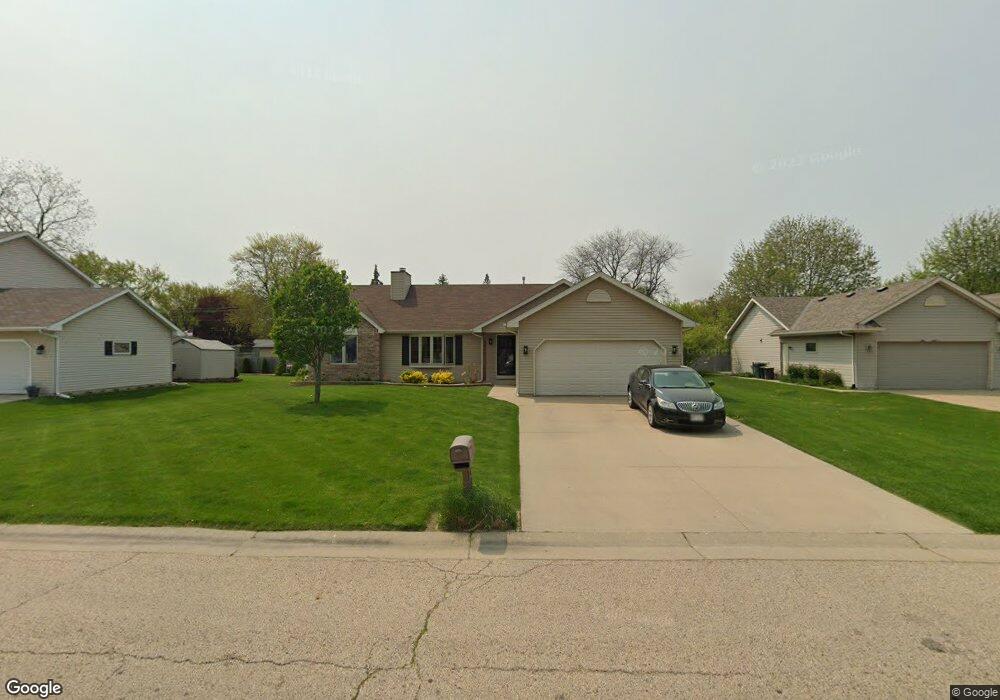
4810 Carter Dr Racine, WI 53402
Estimated Value: $368,000 - $416,000
3
Beds
2
Baths
1,494
Sq Ft
$260/Sq Ft
Est. Value
About This Home
This home is located at 4810 Carter Dr, Racine, WI 53402 and is currently estimated at $388,007, approximately $259 per square foot. 4810 Carter Dr is a home located in Racine County with nearby schools including North Park Elementary School, Olympia Brown Elementary School, and Jerstad-Agerholm Middle School.
Ownership History
Date
Name
Owned For
Owner Type
Purchase Details
Closed on
Jul 8, 2013
Sold by
Correll Jason R and Madden Jenny L
Bought by
Verdiguel Marco
Current Estimated Value
Home Financials for this Owner
Home Financials are based on the most recent Mortgage that was taken out on this home.
Original Mortgage
$201,200
Outstanding Balance
$146,240
Interest Rate
3.91%
Mortgage Type
VA
Estimated Equity
$241,767
Purchase Details
Closed on
Dec 22, 2008
Sold by
Correll Jason R
Bought by
Correll Jason R and Madden Jenny L
Home Financials for this Owner
Home Financials are based on the most recent Mortgage that was taken out on this home.
Original Mortgage
$190,200
Interest Rate
6.06%
Mortgage Type
New Conventional
Purchase Details
Closed on
Aug 10, 2007
Sold by
National Transfer Services Llc
Bought by
Lorrell Jason R
Home Financials for this Owner
Home Financials are based on the most recent Mortgage that was taken out on this home.
Original Mortgage
$191,000
Interest Rate
6.77%
Mortgage Type
New Conventional
Create a Home Valuation Report for This Property
The Home Valuation Report is an in-depth analysis detailing your home's value as well as a comparison with similar homes in the area
Home Values in the Area
Average Home Value in this Area
Purchase History
| Date | Buyer | Sale Price | Title Company |
|---|---|---|---|
| Verdiguel Marco | $197,000 | None Available | |
| Correll Jason R | $95,100 | Premier Title And Closing Se | |
| Lorrell Jason R | $209,900 | -- |
Source: Public Records
Mortgage History
| Date | Status | Borrower | Loan Amount |
|---|---|---|---|
| Open | Verdiguel Marco | $201,200 | |
| Previous Owner | Correll Jason R | $190,200 | |
| Previous Owner | Lorrell Jason R | $191,000 |
Source: Public Records
Tax History Compared to Growth
Tax History
| Year | Tax Paid | Tax Assessment Tax Assessment Total Assessment is a certain percentage of the fair market value that is determined by local assessors to be the total taxable value of land and additions on the property. | Land | Improvement |
|---|---|---|---|---|
| 2024 | $5,639 | $355,800 | $44,300 | $311,500 |
| 2023 | $5,839 | $337,000 | $44,300 | $292,700 |
| 2022 | $5,042 | $310,500 | $44,300 | $266,200 |
| 2021 | $5,040 | $280,900 | $44,300 | $236,600 |
| 2020 | $4,908 | $240,400 | $38,200 | $202,200 |
| 2019 | $4,871 | $240,400 | $38,200 | $202,200 |
| 2018 | $4,249 | $198,100 | $38,200 | $159,900 |
| 2017 | $4,185 | $198,100 | $38,200 | $159,900 |
| 2016 | $4,127 | $195,600 | $38,200 | $157,400 |
| 2015 | $3,963 | $195,600 | $38,200 | $157,400 |
| 2014 | $3,800 | $195,600 | $38,200 | $157,400 |
| 2013 | $4,148 | $195,600 | $38,200 | $157,400 |
Source: Public Records
Map
Nearby Homes
- 1426 Johnson Ave
- 1533 Kremer Ave
- 1732 Kremer Ave
- 1838 Johnson Ave
- 601 4 Mile Rd
- 4218 Lasalle St
- 4418 Douglas Ave
- 5450 Charles St
- 419 4 Mile Rd
- 5536 Whirlaway Ln
- 10 Cherrywood Ct
- 5418 N Meadows Dr
- 1519 Tiffany Dr
- 4032 Marquette Dr
- 3 Birchwood Ct
- 1 Birchwood Ct
- 332 4 Mile Rd
- 5640 Richwood Ln
- 5535 N Meadows Dr
- Windsor Plan at Creekview Estates
- 4802 Carter Dr
- 4818 Carter Dr
- 4811 Charles St
- 4801 Charles St
- 1225 Kilbride Dr
- 4736 Carter Dr
- 4823 Charles St
- 1226 Dundee Dr
- 1300 Kilbride Dr
- 4747 Charles St
- 1228 Kilbride Dr
- 4829 Charles St
- 1203 Kilbride Dr
- 1212 Dundee Dr
- 1208 Kilbride Dr
- 4739 Charles St
- 4839 Charles St
- 1227 Dundee Dr
- 4840 Carter Dr
- 1133 Kilbride Dr