
Seller's Agent in 2018
David Flory
RE/MAX Universal
(281) 477-0345
511 Total Sales

Estimated Value: $239,448 - $254,000
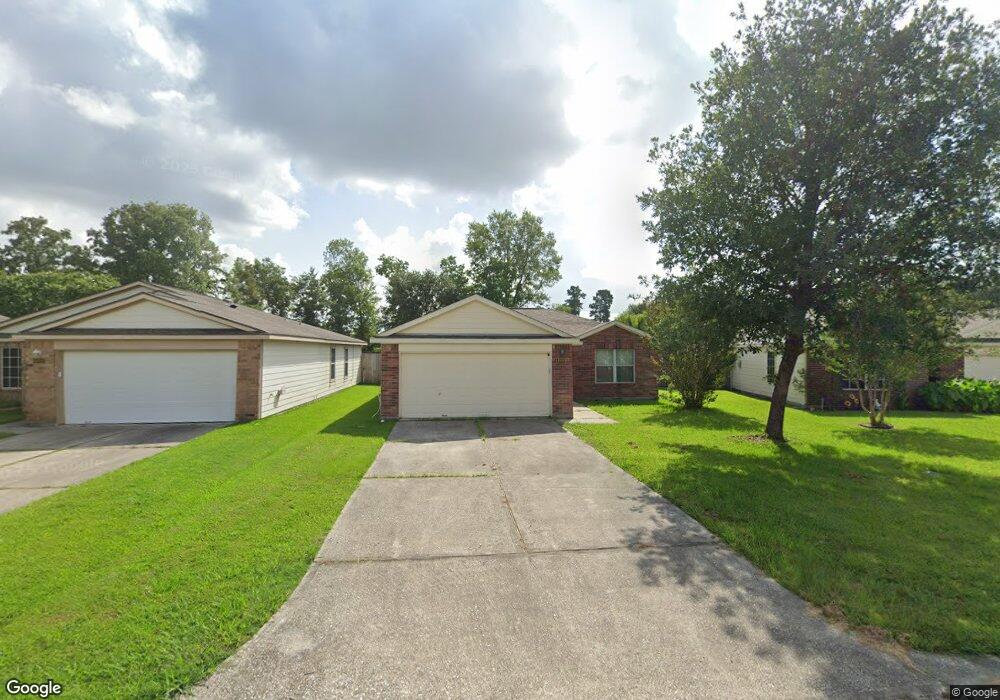
Wonderful well maintained home in the sought after Creekside Village community! Close to the Grand parkway and I45 for an easy commute. Lovely backyard with covered patio and no back neighbors! Open concept in the living area and kitchen great for entertaining friends and family! Master bath features double vanities with a separate shower and large corner tub! Master bedroom also features vaulted ceiling with access to the backyard! Must see, this one won't last long!
Last Buyer's Agent
Candice Godby
Realty ONE Group Iconic License #0643385
| Date | Buyer | Sale Price | Title Company |
|---|---|---|---|
| Buras Louis | -- | Momentum Title Llc | |
| Keller Brian | -- | None Available | |
| Kellar Brian | -- | American Title Co |
| Date | Status | Borrower | Loan Amount |
|---|---|---|---|
| Open | Buras Louis | $136,000 | |
| Previous Owner | Kellar Brian | $120,988 |
| Date | Event | Price | List to Sale | Price per Sq Ft |
|---|---|---|---|---|
| 12/30/2021 12/30/21 | Off Market | -- | -- | -- |
| 04/27/2018 04/27/18 | Sold | -- | -- | -- |
| 03/28/2018 03/28/18 | Pending | -- | -- | -- |
| 03/12/2018 03/12/18 | For Sale | $170,000 | -- | $117 / Sq Ft |
| Year | Tax Paid | Tax Assessment Tax Assessment Total Assessment is a certain percentage of the fair market value that is determined by local assessors to be the total taxable value of land and additions on the property. | Land | Improvement |
|---|---|---|---|---|
| 2025 | $1,126 | $256,488 | $33,544 | $222,944 |
| 2024 | $1,123 | $241,846 | -- | -- |
| 2023 | $1,123 | $219,860 | $33,540 | $219,250 |
| 2022 | $3,468 | $199,870 | $33,540 | $191,670 |
| 2021 | $3,359 | $181,700 | $33,540 | $148,160 |
| 2020 | $3,325 | $171,040 | $33,540 | $137,500 |
| 2019 | $3,322 | $164,900 | $33,540 | $131,360 |
| 2018 | $2,954 | $146,650 | $33,540 | $113,110 |
| 2017 | $2,998 | $149,060 | $33,540 | $115,520 |
| 2016 | $2,770 | $137,690 | $33,540 | $104,150 |
| 2015 | $2,259 | $133,910 | $33,540 | $100,370 |
| 2014 | $2,259 | $111,180 | $33,540 | $77,640 |
Seller's Agent in 2018
David Flory
RE/MAX Universal
(281) 477-0345
511 Total Sales
C
Buyer's Agent in 2018
Candice Godby
Realty ONE Group Iconic
Source: Houston Association of REALTORS®
MLS Number: 77668045
APN: 3527-00-02700
Disclaimer: Certain information contained herein is derived from information provided by parties other than Homes.com. All information provided is deemed reliable, but is not guaranteed to be accurate and should be independently verified.
![]() Copyright 2026, Houston REALTORS® Information Service, Inc.
Copyright 2026, Houston REALTORS® Information Service, Inc.
The information provided is exclusively for consumers’ personal, non-commercial use, and may not be used for any purpose other than to identify prospective properties consumers may be interested in purchasing.
Information is deemed reliable but not guaranteed.
Ask me questions while you tour the home.