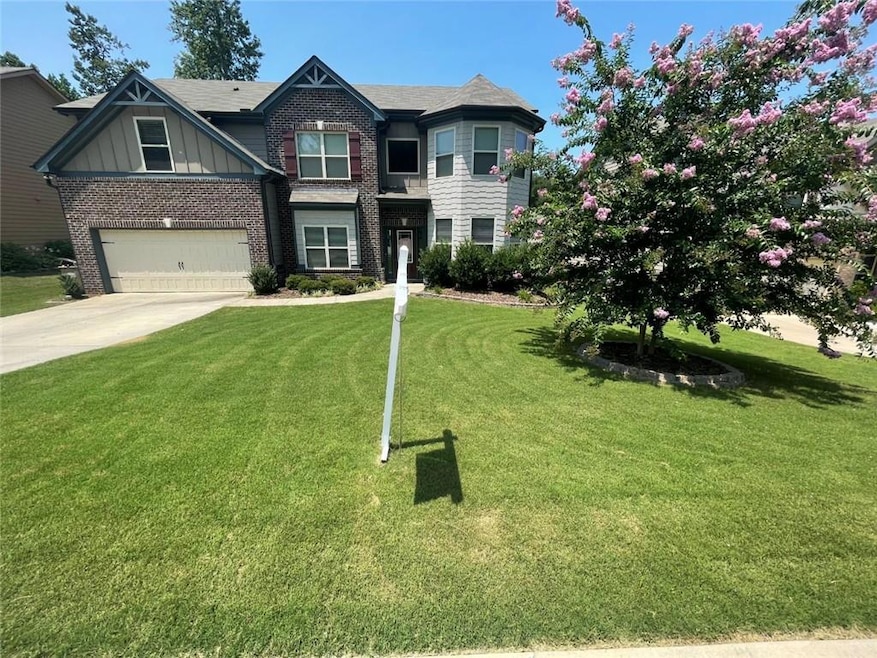


4810 Haysboro Way Cumming, GA 30040
Highlights
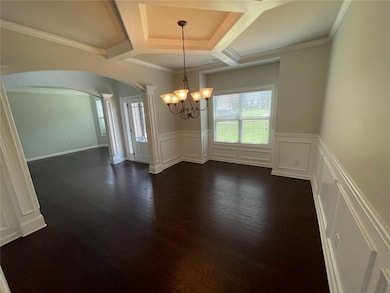
- Media Room
- Dining Room Seats More Than Twelve
- Wood Flooring
- Coal Mountain Elementary School Rated A
- Traditional Architecture
- Great Room
About This Home
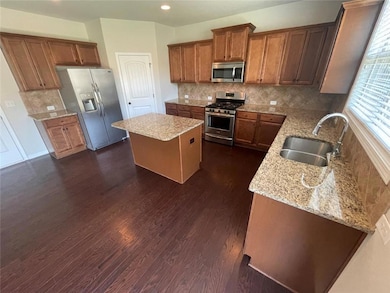
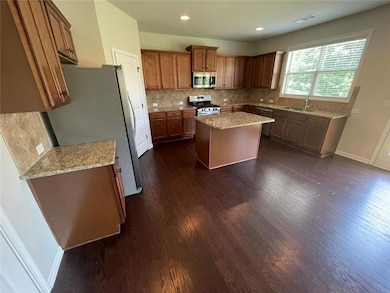
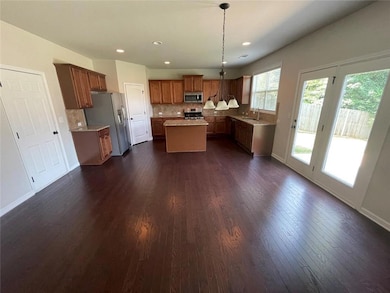
5BR/3BA/2car garage Cumming home in Bridlewood subdivision. Claire floorplan w/Open media room. Grand 2-story foyer, formal living & dining room w/coffered ceilings, living room w/fireplace & open view to kitchen w/island, hardwood floors, granite counters, & stainless steel appliances. Bedroom & full bathroom on main. Upstairs Oversized master suite, spa style bathroom & walk-in closet. Step up media room, 3 additional spacious bedrooms, full bath & laundry room. 2" faux wood blinds throughout. Short drive to Lake Lanier, North Georgia outlet mall & new Walmart Shopping center on Matt Hwy. NO SMOKERS! 1 or 2 small dogs may be allowed with additional nonrefundable pet fee. Bridlewood Amenities - Swimming Pool, Tennis courts, Playground & Clubhouse. Minimum 680 credit score or higher and minimum 3x monthly rent in gross monthly income required to qualify to lease this home. Home will be cleaned & then leased "AS-IS". NO SMOKERS PLEASE!
Home Details
Home Type
- Single Family
Est. Annual Taxes
- $5,320
Year Built
- Built in 2017
Lot Details
- 9,148 Sq Ft Lot
- Private Entrance
- Landscaped
- Level Lot
- Back Yard Fenced
Parking
- 2 Car Attached Garage
- Parking Accessed On Kitchen Level
- Front Facing Garage
- Garage Door Opener
- Driveway Level
Home Design
- Traditional Architecture
- Composition Roof
- Brick Front
Interior Spaces
- 3,070 Sq Ft Home
- 2-Story Property
- Coffered Ceiling
- Tray Ceiling
- Ceiling height of 9 feet on the main level
- Ceiling Fan
- Factory Built Fireplace
- Gas Log Fireplace
- Private Rear Entry
- Entrance Foyer
- Family Room with Fireplace
- Great Room
- Living Room
- Dining Room Seats More Than Twelve
- Breakfast Room
- Formal Dining Room
- Media Room
- Pull Down Stairs to Attic
- Fire and Smoke Detector
Kitchen
- Open to Family Room
- Walk-In Pantry
- Microwave
- Dishwasher
- Kitchen Island
- Stone Countertops
- Wood Stained Kitchen Cabinets
- Disposal
Flooring
- Wood
- Carpet
Bedrooms and Bathrooms
- Split Bedroom Floorplan
- Walk-In Closet
- Vaulted Bathroom Ceilings
- Dual Vanity Sinks in Primary Bathroom
- Separate Shower in Primary Bathroom
- Soaking Tub
Laundry
- Laundry Room
- Laundry on upper level
Outdoor Features
- Patio
- Front Porch
Schools
- Coal Mountain Elementary School
- North Forsyth Middle School
- North Forsyth High School
Utilities
- Forced Air Heating and Cooling System
- Underground Utilities
- Electric Water Heater
- Phone Available
- Cable TV Available
Listing and Financial Details
- Security Deposit $2,800
- 12 Month Lease Term
- $65 Application Fee
- Assessor Parcel Number 190 159
Community Details
Overview
- Property has a Home Owners Association
- Bridlewood Subdivision
Recreation
- Tennis Courts
- Community Playground
- Community Pool
Pet Policy
- Call for details about the types of pets allowed
Map
Source: First Multiple Listing Service (FMLS)
MLS Number: 7668482
APN: 190-159
Disclaimer: Certain information contained herein is derived from information provided by parties other than Homes.com. All information provided is deemed reliable, but is not guaranteed to be accurate and should be independently verified.
![]() Listings identified with the FMLS IDX logo come from FMLS and are held by brokerage firms other than the owner of this website. The listing brokerage is identified in any listing details. Information is deemed reliable but is not guaranteed. If you believe any FMLS listing contains material that infringes your copyrighted work please visit www.fmls.com/dmca to review our DMCA policy and learn how to submit a takedown request. © 2025 First Multiple Listing Service, Inc.
Listings identified with the FMLS IDX logo come from FMLS and are held by brokerage firms other than the owner of this website. The listing brokerage is identified in any listing details. Information is deemed reliable but is not guaranteed. If you believe any FMLS listing contains material that infringes your copyrighted work please visit www.fmls.com/dmca to review our DMCA policy and learn how to submit a takedown request. © 2025 First Multiple Listing Service, Inc.
- 4095 Sierra Vista Cir
- 4115 Sierra Vista Cir
- 4085 Sierra Vista Cir
- 4120 Sierra Vista Cir
- 4015 Sierra Vista Cir
- 4420 Belcrest Way
- 3810 Sierra Lake Dr
- 3735 Sierra Lake Dr
- 3725 Sierra Lake Dr
- The Colton Plan at Sierra Lake
- The Margaret Plan at Sierra Lake
- The Beckett Plan at Sierra Lake
- The Claire Plan at Sierra Lake
- The Sophia Plan at Sierra Lake
- The Charleston Plan at Sierra Lake
- 3995 Sierra Lake Dr
- 3365 Buffington Ln
- 4010 Sierra Knolls Ct
- 4230 Jonathan Ln
- 4020 Sierra Knolls Ct
- 4015 Sierra Vista Cir
- 3930 Cutler Donahoe Way
- 3917 Cutler Donahoe Way
- 3880 New Salem Ct
- 3680 Roseman Landing
- 3734 Humber Ct
- 3738 Humber Ct
- 5375 Rialto Way
- 4245 Arch Pass
- 7290 Hickory Bluff Dr
- 4865 Roseman Trail
- 4085 Huron Dr
- 5715 Bucknell Trace
- 2719 Bettis Tribble Gap Rd
- 5250 Whisper Point Blvd
- 2719 Bettis Tribble Rd
- 3320 Ragan Ct
- 5160 Bucknell Trace
- 3015 Whittier Way Unit 3015
- 2920 Centerglen Ln
