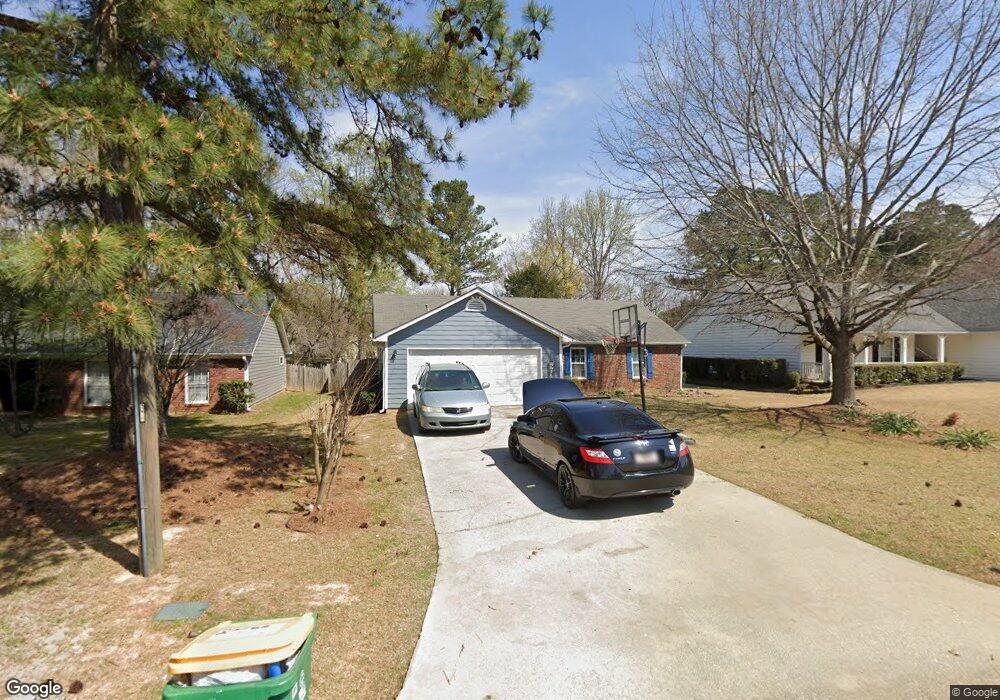
4810 Minden Chase Unit 3 Alpharetta, GA 30022
Estimated Value: $404,000 - $514,000
3
Beds
2
Baths
1,438
Sq Ft
$320/Sq Ft
Est. Value
About This Home
This home is located at 4810 Minden Chase Unit 3, Alpharetta, GA 30022 and is currently estimated at $460,729, approximately $320 per square foot. 4810 Minden Chase Unit 3 is a home located in Fulton County with nearby schools including Ocee Elementary School, Taylor Road Middle School, and Chattahoochee High School.
Ownership History
Date
Name
Owned For
Owner Type
Purchase Details
Closed on
Mar 25, 2020
Sold by
Light Bonnie B
Bought by
Gamarra Karina C Mejia and Mendoza Pedro P
Current Estimated Value
Home Financials for this Owner
Home Financials are based on the most recent Mortgage that was taken out on this home.
Original Mortgage
$262,654
Outstanding Balance
$236,409
Interest Rate
4.4%
Mortgage Type
FHA
Estimated Equity
$224,320
Purchase Details
Closed on
Sep 4, 2003
Sold by
Gunnells Addie F
Bought by
Light Bonnie B
Home Financials for this Owner
Home Financials are based on the most recent Mortgage that was taken out on this home.
Original Mortgage
$140,885
Interest Rate
5.5%
Mortgage Type
New Conventional
Purchase Details
Closed on
Sep 1, 2000
Sold by
Knocke Robert and Knocke Colleen
Bought by
Gunnells Addie F
Home Financials for this Owner
Home Financials are based on the most recent Mortgage that was taken out on this home.
Original Mortgage
$137,740
Interest Rate
8.11%
Mortgage Type
New Conventional
Create a Home Valuation Report for This Property
The Home Valuation Report is an in-depth analysis detailing your home's value as well as a comparison with similar homes in the area
Home Values in the Area
Average Home Value in this Area
Purchase History
| Date | Buyer | Sale Price | Title Company |
|---|---|---|---|
| Gamarra Karina C Mejia | $267,500 | -- | |
| Light Bonnie B | $148,300 | -- | |
| Gunnells Addie F | $142,000 | -- |
Source: Public Records
Mortgage History
| Date | Status | Borrower | Loan Amount |
|---|---|---|---|
| Open | Gamarra Karina C Mejia | $262,654 | |
| Previous Owner | Light Bonnie B | $140,885 | |
| Previous Owner | Gunnells Addie F | $137,740 |
Source: Public Records
Tax History Compared to Growth
Tax History
| Year | Tax Paid | Tax Assessment Tax Assessment Total Assessment is a certain percentage of the fair market value that is determined by local assessors to be the total taxable value of land and additions on the property. | Land | Improvement |
|---|---|---|---|---|
| 2025 | $2,826 | $196,360 | $51,880 | $144,480 |
| 2023 | $4,346 | $153,960 | $46,120 | $107,840 |
| 2022 | $2,702 | $129,720 | $28,040 | $101,680 |
| 2021 | $2,666 | $106,880 | $27,720 | $79,160 |
| 2020 | $3,100 | $96,320 | $24,320 | $72,000 |
| 2019 | $373 | $94,600 | $23,880 | $70,720 |
| 2018 | $2,749 | $84,400 | $21,800 | $62,600 |
| 2017 | $1,793 | $64,840 | $14,880 | $49,960 |
| 2016 | $1,759 | $64,840 | $14,880 | $49,960 |
| 2015 | $1,778 | $64,840 | $14,880 | $49,960 |
| 2014 | $1,738 | $62,320 | $14,760 | $47,560 |
Source: Public Records
Map
Nearby Homes
- 4790 Roswell Mill Dr
- 130 Douglas Fir Ct Unit 1
- 11390 Ridge Hill Dr
- 4965 N Bridges Dr
- 4905 Weathervane Dr
- 4740 Carversham Way
- 690 Kimball Parc Way
- 485 Portrait Cir
- 680 Kimball Parc Way
- 310 Creekside Dr
- 4965 Cinnabar Dr
- 5060 Cinnabar Dr
- 5022 Anclote Dr
- 11686 Davenport Ln
- 11619 Davenport Ln
- 5160 Abbotts Bridge Rd
- 134 Wards Crossing Way Unit 17
- 11085 State Bridge Rd
- 4645 Valais Ct Unit 109
- 11150 Highfield Chase Dr
- 4820 Minden Chase Unit 3
- 4800 Minden Chase Unit 3
- 4830 Minden Chase Unit 3
- 4790 Minden Chase
- 240 Jones Bridge Place Cir
- 250 Jones Bridge Place Cir
- 230 Jones Bridge Place Cir
- 0 Minden Chase Unit 8640267
- 0 Minden Chase Unit 8701976
- 0 Minden Chase Unit 9057814
- 0 Minden Chase Unit 7087107
- 0 Minden Chase
- 4840 Minden Chase Unit 3
- 4840 Minden Chase
- 4780 Minden Chase Unit 3
- 4805 Minden Chase Unit 12
- 4805 Minden Chase
- 4805 Minden Chase Unit 4805
- 260 Jones Bridge Place Cir
- 4795 Minden Chase