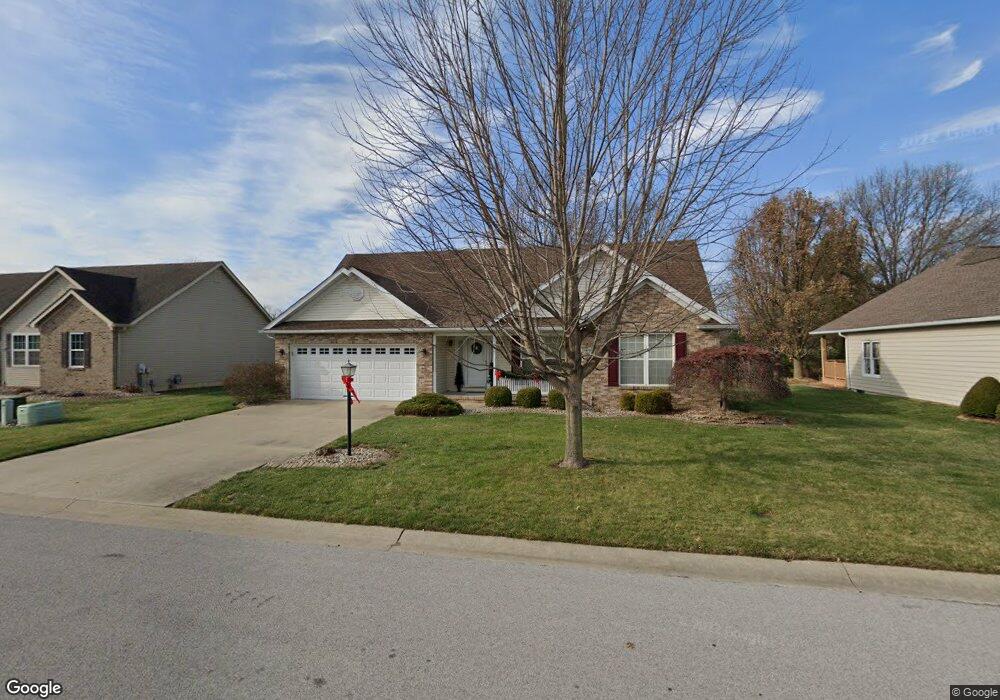
4810 Pear Tree Ln Godfrey, IL 62035
Estimated Value: $209,834 - $305,000
2
Beds
3
Baths
1,380
Sq Ft
$181/Sq Ft
Est. Value
About This Home
This home is located at 4810 Pear Tree Ln, Godfrey, IL 62035 and is currently estimated at $249,209, approximately $180 per square foot. 4810 Pear Tree Ln is a home located in Madison County with nearby schools including North Elementary School, Alton Middle School, and Alton High School.
Ownership History
Date
Name
Owned For
Owner Type
Purchase Details
Closed on
Jul 25, 2012
Sold by
Burger Richard and Burger Mary Judith
Bought by
Burger Richard and Burger Mary J
Current Estimated Value
Purchase Details
Closed on
Dec 30, 2009
Sold by
Hill Gregory M and Hill Linda
Bought by
Burger Richard and Burger Mary Judith
Home Financials for this Owner
Home Financials are based on the most recent Mortgage that was taken out on this home.
Original Mortgage
$134,900
Outstanding Balance
$88,345
Interest Rate
4.9%
Mortgage Type
New Conventional
Estimated Equity
$160,864
Purchase Details
Closed on
Feb 19, 2009
Sold by
Hill Janice R
Bought by
Hill Gregory M and Gibbs Lisa A
Purchase Details
Closed on
May 1, 2006
Sold by
Hill Janice R
Bought by
Hill Gregory M and Gibbs Lisa A
Create a Home Valuation Report for This Property
The Home Valuation Report is an in-depth analysis detailing your home's value as well as a comparison with similar homes in the area
Home Values in the Area
Average Home Value in this Area
Purchase History
| Date | Buyer | Sale Price | Title Company |
|---|---|---|---|
| Burger Richard | -- | None Available | |
| Burger Richard | $142,000 | Serenity Title & Escrow Ltd | |
| Hill Gregory M | -- | Serenity Title & Escrow Ltd | |
| Hill Gregory M | -- | Serenity Title & Escrow Ltd |
Source: Public Records
Mortgage History
| Date | Status | Borrower | Loan Amount |
|---|---|---|---|
| Open | Burger Richard | $134,900 |
Source: Public Records
Tax History Compared to Growth
Tax History
| Year | Tax Paid | Tax Assessment Tax Assessment Total Assessment is a certain percentage of the fair market value that is determined by local assessors to be the total taxable value of land and additions on the property. | Land | Improvement |
|---|---|---|---|---|
| 2024 | $3,657 | $65,240 | $11,630 | $53,610 |
| 2023 | $3,657 | $60,230 | $10,740 | $49,490 |
| 2022 | $2,426 | $55,080 | $9,820 | $45,260 |
| 2021 | $2,589 | $51,810 | $9,240 | $42,570 |
| 2020 | $2,599 | $50,690 | $9,040 | $41,650 |
| 2019 | $2,734 | $49,360 | $8,800 | $40,560 |
| 2018 | $2,734 | $47,260 | $8,430 | $38,830 |
| 2017 | $2,808 | $47,260 | $8,430 | $38,830 |
| 2016 | $2,727 | $47,260 | $8,430 | $38,830 |
| 2015 | $2,430 | $45,770 | $8,160 | $37,610 |
| 2014 | $2,430 | $45,770 | $8,160 | $37,610 |
| 2013 | $2,430 | $45,770 | $8,160 | $37,610 |
Source: Public Records
Map
Nearby Homes
- 1300 Duval Dr
- 4809 Paris Dr
- 4803 Paris Dr
- 4813 Seine Dr
- 4918 Chateau Dr
- 1504 Paris Dr
- 2816 Ridgedale Dr
- 2723 Walter St
- 2704 Greenwood Ln
- 1005 Lexington Estates Dr Unit 152
- 1713 Aster Ln
- 1717 Aster Ln
- 2609 Mariana Dr
- 2811 Francis Dr
- 1200 White Oak Trail
- 1012 Richard Dr
- 2602 Rutledge St
- 1300 White Oak Trail
- 645 Elfgen St
- 5402 Woodland Meadows Dr
- 4808 Pear Tree Ln
- 1 E Hanser Ln
- 4812 Pear Tree Ln
- 4806 Pear Tree Ln
- 4809 Pear Tree Ln
- 4900 Pear Tree Ln
- 4804 Pear Tree Ln
- 4811 Pear Tree Ln
- 4902 Pear Tree Ln
- 4805 Pear Tree Ln
- 1209 Rosewood Ct
- 1210 Cherry Tree Ln
- 1212 Rosewood Ct
- 1209 Cherry Tree Ln
- 4802 Pear Tree Ln
- 1207 Rosewood Ct
- 4904 Pear Tree Ln
- 1208 Cherry Tree Ln
- 1210 Rosewood Ct
- 1207 Cherry Tree Ln