Estimated Value: $447,000 - $485,000
4
Beds
2
Baths
3,163
Sq Ft
$147/Sq Ft
Est. Value
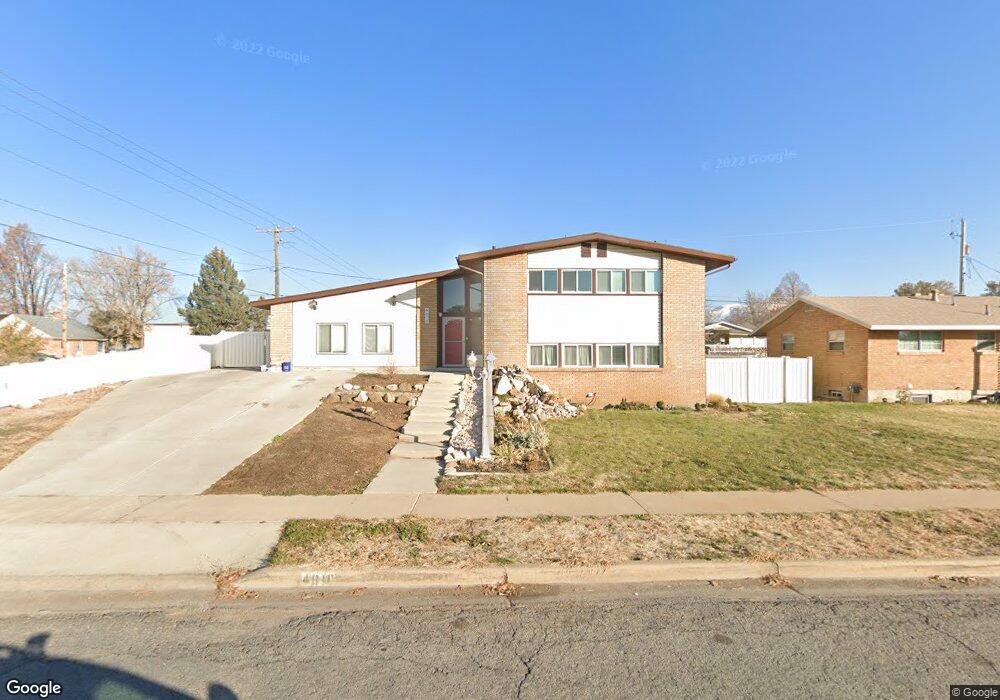
About This Home
This home is located at 4810 S 2350 W, Roy, UT 84067 and is currently estimated at $464,172, approximately $146 per square foot. 4810 S 2350 W is a home located in Weber County with nearby schools including Lakeview Elementary School, Roy Junior High School, and Roy High School.
Ownership History
Date
Name
Owned For
Owner Type
Purchase Details
Closed on
Mar 23, 2018
Sold by
Averet Nathan and Averet Amanda
Bought by
Farnsworth Joseph and Farnsworth Alisha
Current Estimated Value
Home Financials for this Owner
Home Financials are based on the most recent Mortgage that was taken out on this home.
Original Mortgage
$230,644
Outstanding Balance
$199,882
Interest Rate
4.87%
Mortgage Type
FHA
Estimated Equity
$264,290
Purchase Details
Closed on
Nov 7, 2002
Sold by
Tanner John W and Tanner Anita G
Bought by
Averett Nathan and Averett Amanda
Home Financials for this Owner
Home Financials are based on the most recent Mortgage that was taken out on this home.
Original Mortgage
$100,000
Interest Rate
5.95%
Purchase Details
Closed on
Aug 21, 2002
Sold by
Tanner John W and Tanner Anita G
Bought by
Tanner John W and Tanner Anita G
Create a Home Valuation Report for This Property
The Home Valuation Report is an in-depth analysis detailing your home's value as well as a comparison with similar homes in the area
Home Values in the Area
Average Home Value in this Area
Purchase History
| Date | Buyer | Sale Price | Title Company |
|---|---|---|---|
| Farnsworth Joseph | -- | Us Title Insurance Agency | |
| Averett Nathan | -- | Bonneville Title | |
| Tanner John W | -- | -- |
Source: Public Records
Mortgage History
| Date | Status | Borrower | Loan Amount |
|---|---|---|---|
| Open | Farnsworth Joseph | $230,644 | |
| Previous Owner | Averett Nathan | $100,000 |
Source: Public Records
Tax History Compared to Growth
Tax History
| Year | Tax Paid | Tax Assessment Tax Assessment Total Assessment is a certain percentage of the fair market value that is determined by local assessors to be the total taxable value of land and additions on the property. | Land | Improvement |
|---|---|---|---|---|
| 2025 | $2,829 | $452,257 | $102,000 | $350,257 |
| 2024 | $2,673 | $235,949 | $56,100 | $179,849 |
| 2023 | $2,453 | $215,600 | $53,680 | $161,920 |
| 2022 | $2,594 | $235,950 | $49,091 | $186,859 |
| 2021 | $2,004 | $297,000 | $59,495 | $237,505 |
| 2020 | $1,908 | $260,000 | $59,495 | $200,505 |
| 2019 | $1,799 | $230,000 | $34,016 | $195,984 |
| 2018 | $1,648 | $197,000 | $31,460 | $165,540 |
| 2017 | $1,737 | $197,000 | $31,460 | $165,540 |
| 2016 | $1,769 | $108,607 | $16,167 | $92,440 |
| 2015 | $1,720 | $108,607 | $16,167 | $92,440 |
| 2014 | $1,569 | $96,912 | $13,736 | $83,176 |
Source: Public Records
Map
Nearby Homes