Estimated Value: $427,000 - $484,000
4
Beds
3
Baths
2,136
Sq Ft
$215/Sq Ft
Est. Value
About This Home
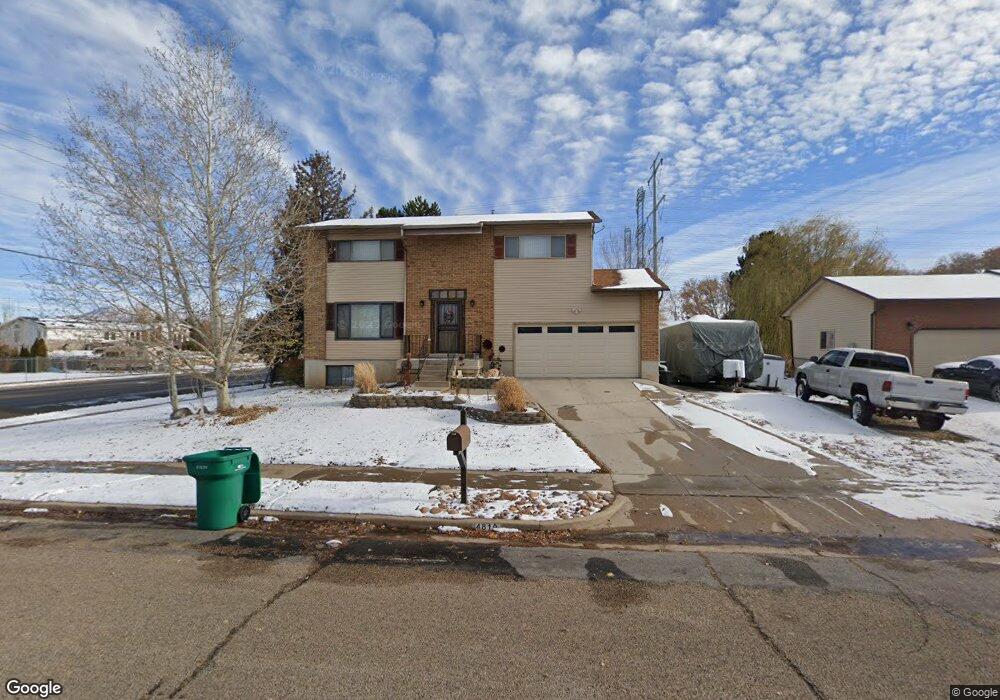
This home is located at 4810 S 3300 W, Roy, UT 84067 and is currently estimated at $458,965, approximately $214 per square foot. 4810 S 3300 W is a home located in Weber County with nearby schools including Midland School, Sand Ridge Junior High School, and Roy High School.
Ownership History
Date
Name
Owned For
Owner Type
Purchase Details
Closed on
Feb 26, 2008
Sold by
Mangum Dewain
Bought by
Mangum Dewain
Current Estimated Value
Purchase Details
Closed on
Oct 29, 1998
Sold by
Christensen Ronald C and Christensen Janice
Bought by
Mangum Dewain
Home Financials for this Owner
Home Financials are based on the most recent Mortgage that was taken out on this home.
Original Mortgage
$111,550
Outstanding Balance
$24,370
Interest Rate
6.6%
Mortgage Type
Purchase Money Mortgage
Estimated Equity
$434,595
Purchase Details
Closed on
Feb 23, 1998
Sold by
Christensen Ronald
Bought by
Christensen Ronald C
Home Financials for this Owner
Home Financials are based on the most recent Mortgage that was taken out on this home.
Original Mortgage
$69,500
Interest Rate
6.9%
Mortgage Type
Purchase Money Mortgage
Create a Home Valuation Report for This Property
The Home Valuation Report is an in-depth analysis detailing your home's value as well as a comparison with similar homes in the area
Home Values in the Area
Average Home Value in this Area
Purchase History
| Date | Buyer | Sale Price | Title Company |
|---|---|---|---|
| Mangum Dewain | -- | Accommodation | |
| Mangum Dewain | -- | Northern Title | |
| Christensen Ronald C | -- | First American Title |
Source: Public Records
Mortgage History
| Date | Status | Borrower | Loan Amount |
|---|---|---|---|
| Open | Mangum Dewain | $111,550 | |
| Previous Owner | Christensen Ronald C | $69,500 |
Source: Public Records
Tax History Compared to Growth
Tax History
| Year | Tax Paid | Tax Assessment Tax Assessment Total Assessment is a certain percentage of the fair market value that is determined by local assessors to be the total taxable value of land and additions on the property. | Land | Improvement |
|---|---|---|---|---|
| 2025 | $2,774 | $442,601 | $130,474 | $312,127 |
| 2024 | $2,707 | $239,249 | $71,767 | $167,482 |
| 2023 | $2,593 | $229,350 | $62,455 | $166,895 |
| 2022 | $2,738 | $250,250 | $57,443 | $192,807 |
| 2021 | $2,161 | $323,000 | $76,551 | $246,449 |
| 2020 | $1,993 | $273,000 | $76,551 | $196,449 |
| 2019 | $1,897 | $244,000 | $43,569 | $200,431 |
| 2018 | $1,744 | $210,000 | $38,901 | $171,099 |
| 2017 | $1,557 | $174,000 | $38,901 | $135,099 |
| 2016 | $1,543 | $93,048 | $21,072 | $71,976 |
| 2015 | $1,397 | $85,722 | $21,072 | $64,650 |
| 2014 | $1,382 | $83,866 | $21,072 | $62,794 |
Source: Public Records
Map
Nearby Homes
- 4964 S 3375 W
- 3509 W 4835 S Unit 26
- 3524 W 4835 S Unit 22
- 3523 W 4835 S Unit 28
- 3046 W 4850 S
- 4510 Stone Creek Rd Unit F
- 4491 Haven Creek Rd Unit A
- 3014 W 4750 S
- 3434 W 4525 S
- Poplar Plan at Highgate Cove
- Pando Plan at Highgate Cove
- 3627 W 4650 S
- 4440 Stone Creek Rd Unit 2E
- 3632 W 4650 S
- 3671 W 4700 S
- 4918 S 2925 W
- 4635 S 2950 W
- 4891 S 2875 W
- 3652 W 4625 S
- 5009 S 2925 W