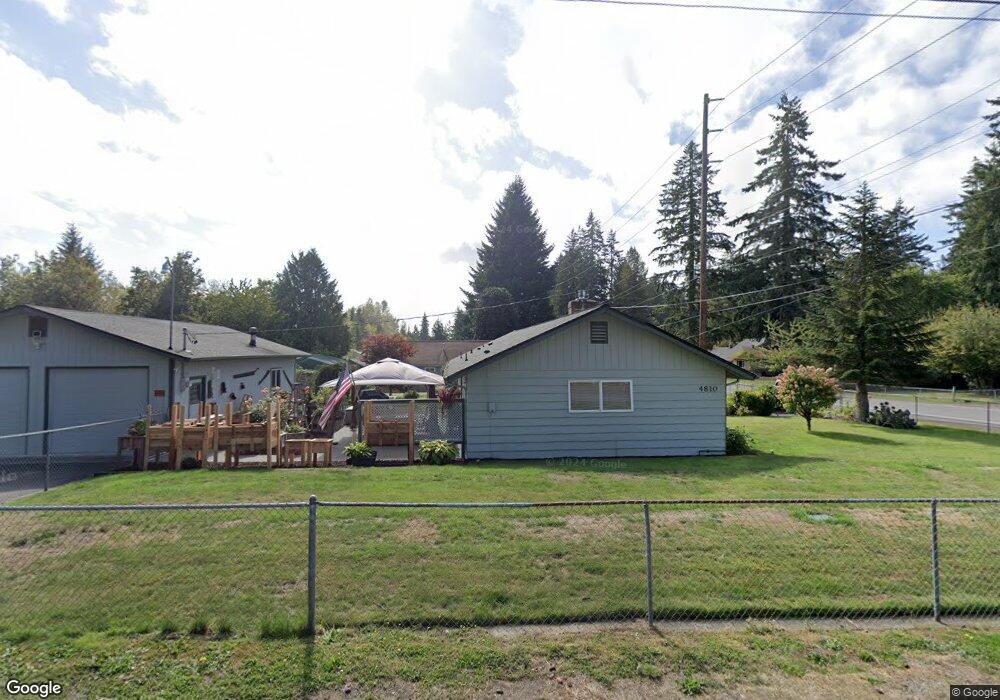
4810 SE Foss Rd Port Orchard, WA 98366
Estimated Value: $415,000 - $463,000
3
Beds
1
Bath
1,416
Sq Ft
$306/Sq Ft
Est. Value
About This Home
This home is located at 4810 SE Foss Rd, Port Orchard, WA 98366 and is currently estimated at $432,954, approximately $305 per square foot. 4810 SE Foss Rd is a home located in Kitsap County with nearby schools including Orchard Heights Elementary School, Marcus Whitman Middle School, and South Kitsap High School.
Ownership History
Date
Name
Owned For
Owner Type
Purchase Details
Closed on
May 8, 2009
Sold by
Dombrock Brenda K
Bought by
Dombrock John W
Current Estimated Value
Purchase Details
Closed on
Aug 20, 1998
Sold by
Brown Edwin W and Brown Bonnie R
Bought by
Dombrock John W and Dombrock Brenda K
Home Financials for this Owner
Home Financials are based on the most recent Mortgage that was taken out on this home.
Original Mortgage
$113,950
Interest Rate
6.88%
Create a Home Valuation Report for This Property
The Home Valuation Report is an in-depth analysis detailing your home's value as well as a comparison with similar homes in the area
Home Values in the Area
Average Home Value in this Area
Purchase History
| Date | Buyer | Sale Price | Title Company |
|---|---|---|---|
| Dombrock John W | -- | None Available | |
| Dombrock John W | $119,950 | Charter Title Corporation |
Source: Public Records
Mortgage History
| Date | Status | Borrower | Loan Amount |
|---|---|---|---|
| Previous Owner | Dombrock John W | $113,950 |
Source: Public Records
Tax History Compared to Growth
Tax History
| Year | Tax Paid | Tax Assessment Tax Assessment Total Assessment is a certain percentage of the fair market value that is determined by local assessors to be the total taxable value of land and additions on the property. | Land | Improvement |
|---|---|---|---|---|
| 2026 | $3,000 | $345,200 | $82,160 | $263,040 |
| 2025 | $3,000 | $345,200 | $82,160 | $263,040 |
| 2024 | $2,908 | $345,200 | $82,160 | $263,040 |
| 2023 | $2,887 | $345,200 | $82,160 | $263,040 |
| 2022 | $2,781 | $278,380 | $65,860 | $212,520 |
| 2021 | $2,683 | $254,570 | $62,720 | $191,850 |
| 2020 | $2,456 | $225,970 | $55,940 | $170,030 |
| 2019 | $2,114 | $213,940 | $52,760 | $161,180 |
| 2018 | $2,225 | $181,610 | $54,940 | $126,670 |
| 2017 | $1,969 | $181,610 | $54,940 | $126,670 |
| 2016 | $1,951 | $164,800 | $54,940 | $109,860 |
| 2015 | $1,892 | $162,150 | $54,940 | $107,210 |
| 2014 | -- | $159,490 | $54,940 | $104,550 |
| 2013 | -- | $163,740 | $57,830 | $105,910 |
Source: Public Records
Map
Nearby Homes
- 1400 Baby Doll Rd SE
- 824 Cherub Place E
- 4258 SE Woodford Ct
- 1560 Woodridge Dr SE
- 1200 Baby Doll Rd E
- 71 Carson Ave SE
- 1135 Hillandale Dr E
- 4010 SE Lovell St
- 4898 E Collins Rd
- 3884 Madrona Dr SE
- 3930 SE Mile Hill Dr
- 3900 SE Mile Hill Dr
- 5101 SE Natchez Ct
- 1242 Lidstrom Rd E
- 2169 Ponderosa Dr SE
- 740 Tufts Ave E
- 803 Collins Creek Ln E
- 1663 Harrison Ave SE
- 0 Wendell Ave SE
- 2014 Kelowna Place SE
- 4800 SE Foss Rd
- 4910 SE Foss Rd
- 999 Baby Doll Rd SE
- 4801 SE Foss Rd
- 4786 SE Foss Rd
- 1038 Baby Doll Rd SE
- 4849 SE Foss Rd
- 967 Baby Doll Rd SE
- 976 Baby Doll Rd SE
- 4920 SE Foss Rd
- 1073 Baby Doll Rd SE
- 954 Baby Doll Rd SE
- 951 Baby Doll Rd SE
- 936 Baby Doll Rd SE
- 4761 SE Foss Rd
- 1187 Baby Doll Rd SE
- 1144 Baby Doll Rd SE
- 4927 SE Foss Rd