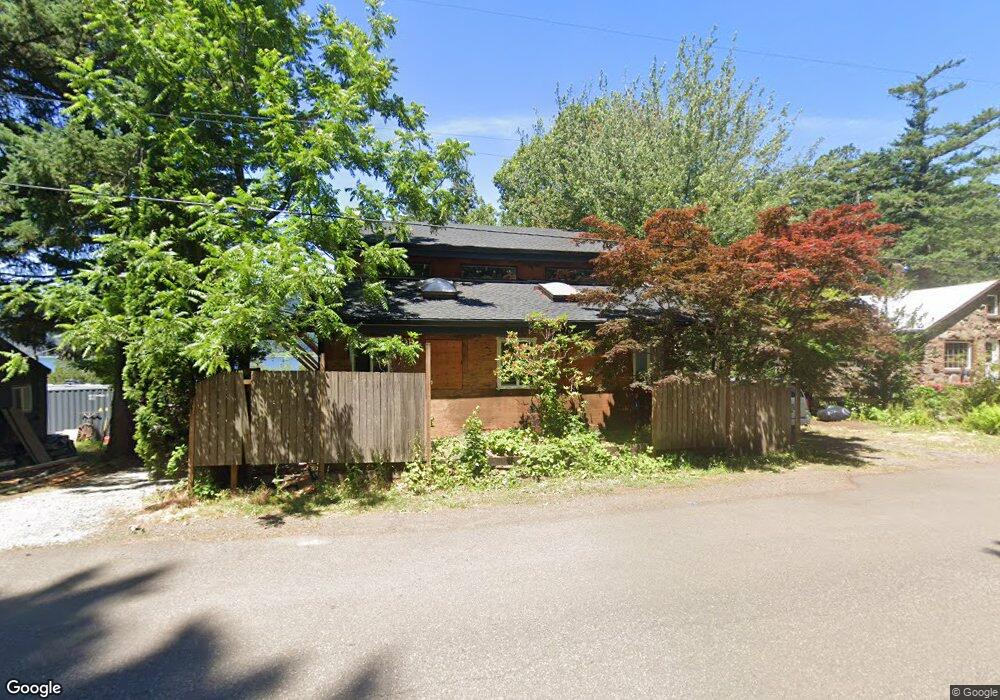
48107 E Historic Columbia River Hwy Corbett, OR 97019
NEMCCA NeighborhoodEstimated Value: $489,117 - $676,000
4
Beds
3
Baths
2,490
Sq Ft
$236/Sq Ft
Est. Value
About This Home
This home is located at 48107 E Historic Columbia River Hwy, Corbett, OR 97019 and is currently estimated at $588,029, approximately $236 per square foot. 48107 E Historic Columbia River Hwy is a home located in Multnomah County.
Ownership History
Date
Name
Owned For
Owner Type
Purchase Details
Closed on
Sep 20, 2022
Sold by
Lrb Properties Llc
Bought by
Miller Wade and Chaffee Renee
Current Estimated Value
Home Financials for this Owner
Home Financials are based on the most recent Mortgage that was taken out on this home.
Original Mortgage
$380,000
Outstanding Balance
$164,975
Interest Rate
5.66%
Mortgage Type
Seller Take Back
Estimated Equity
$423,054
Purchase Details
Closed on
Dec 10, 2013
Sold by
Burbach Randall S
Bought by
Burbach Randall S and The Randall S Burbach Trust
Purchase Details
Closed on
Feb 12, 2013
Sold by
Jp Morgan Chase Bank National Associatio
Bought by
Burbach Randall S
Purchase Details
Closed on
Jan 24, 2012
Sold by
Shipp Gregory W
Bought by
Jpmorgan Chase Bank National Association
Purchase Details
Closed on
May 6, 2002
Sold by
Shipp Dc Gregory W
Bought by
Shipp Gregory W
Purchase Details
Closed on
Apr 23, 2002
Sold by
Multnomah County
Bought by
Shipp Dc Dr Gregory W
Create a Home Valuation Report for This Property
The Home Valuation Report is an in-depth analysis detailing your home's value as well as a comparison with similar homes in the area
Home Values in the Area
Average Home Value in this Area
Purchase History
| Date | Buyer | Sale Price | Title Company |
|---|---|---|---|
| Miller Wade | $450,000 | First American Title | |
| Burbach Randall S | -- | None Available | |
| Burbach Randall S | $40,000 | None Available | |
| Jpmorgan Chase Bank National Association | $144,077 | Fatco | |
| Shipp Gregory W | -- | Chicago Title | |
| Shipp Dc Dr Gregory W | $36,287 | Chicago Title Co |
Source: Public Records
Mortgage History
| Date | Status | Borrower | Loan Amount |
|---|---|---|---|
| Open | Miller Wade | $380,000 |
Source: Public Records
Tax History Compared to Growth
Tax History
| Year | Tax Paid | Tax Assessment Tax Assessment Total Assessment is a certain percentage of the fair market value that is determined by local assessors to be the total taxable value of land and additions on the property. | Land | Improvement |
|---|---|---|---|---|
| 2024 | $1,361 | $92,310 | -- | -- |
| 2023 | $1,774 | $119,380 | $0 | $0 |
| 2022 | $1,628 | $115,910 | $0 | $0 |
| 2021 | $1,577 | $112,540 | $0 | $0 |
| 2020 | $1,376 | $109,270 | $0 | $0 |
| 2019 | $1,335 | $106,090 | $0 | $0 |
| 2018 | $1,295 | $103,000 | $0 | $0 |
| 2017 | $1,255 | $100,000 | $0 | $0 |
| 2016 | $1,218 | $97,090 | $0 | $0 |
| 2015 | $1,192 | $94,270 | $0 | $0 |
| 2014 | $1,158 | $91,530 | $0 | $0 |
Source: Public Records
Map
Nearby Homes
- 47845 E Hist Columbia River Hwy
- 48025 E Historic Columbia Ri Hwy
- 2220 NE Brower Rd
- 281 Prindle Rd
- 0 Mt Pleasant Rd Unit tract 1 24567142
- 161 Meko Way
- 201 Kenco Rd
- 192 Karousel Ln Unit 1-3
- 192 Karousel Ln Unit 1
- 282 Karousel Ln
- 1141 Cedar Falls Rd
- 41300 E Larch Mountain Rd
- 61 Joy Rd
- 0 Wildlife Rd Unit NWM2359614
- 0 Wildlife Rd Unit 24581069
- 11971 Washougal River Rd
- 452 Wildlife Rd
- 32 Laurel Ln S
- 1072 Labarre Rd
- 422 Stone Dr
- 48103 E Historic Columbia River Hwy
- 48109 E Historic Columbia River Hwy
- 48045 E Historic Columbia River Hwy
- 48111 E Historic Columbia River Hwy
- 48045 Historic Columbia River Hwy
- 48117 E Historic Columbia River Hwy
- 48117 Historic Columbia River Hwy
- 48115 E Historic Columbia River Hwy
- 48115 E Historic Columbia River Hwy
- 48115 E Columbia Rvr Hwy
- 48115 Hst Columbia River Hwy
- 48025 E Historic Columbia River Hwy
- 47925 E Historic Columbia River Hwy
- 47925 E Historic Columbia River Hwy
- 48100 E Historic Columbia River Hwy
- 47920 E Historic Columbia River Hwy
- 47845 E Historic Columbia River Hwy
- 47845 E Historic Columbia River Hwy
- 47845 E Hist Columbia Rvr Hwy
- 47645 N E Hist Columbia Rive Hwy