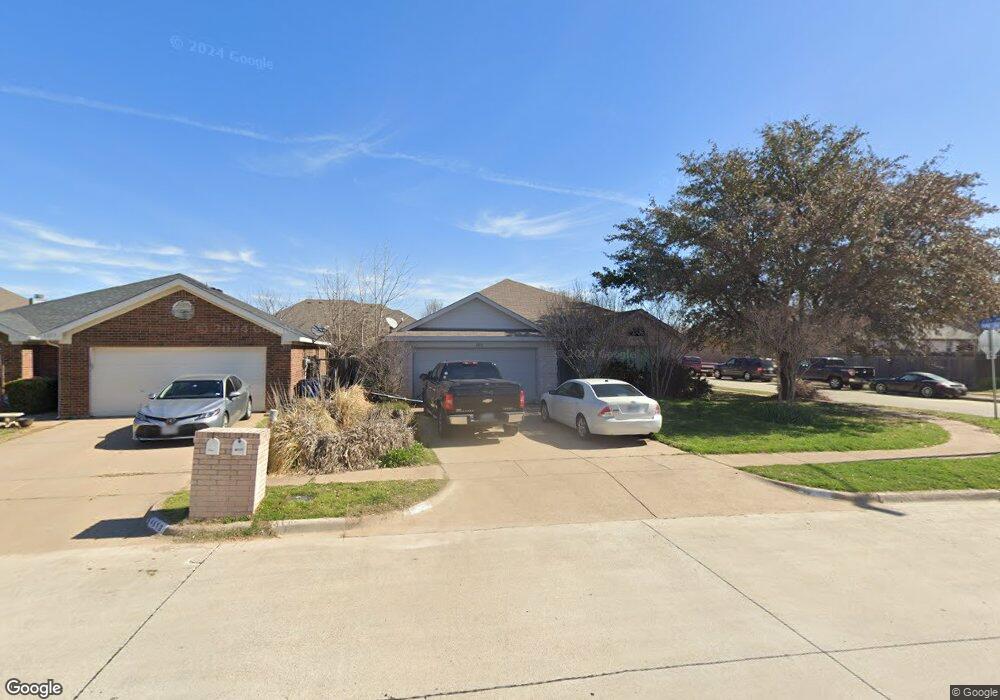
4811 Topaz Ln Granbury, TX 76049
Estimated Value: $289,346 - $326,000
3
Beds
2
Baths
1,841
Sq Ft
$168/Sq Ft
Est. Value
About This Home
This home is located at 4811 Topaz Ln, Granbury, TX 76049 and is currently estimated at $308,837, approximately $167 per square foot. 4811 Topaz Ln is a home located in Hood County with nearby schools including Oak Woods School, Acton Middle School, and Granbury High School.
Ownership History
Date
Name
Owned For
Owner Type
Purchase Details
Closed on
Jan 16, 2017
Sold by
Osborn Kenneth Janes and Osborn Wynona Kaye
Bought by
Osborn Real Estate Investments Llc
Current Estimated Value
Purchase Details
Closed on
Mar 15, 2010
Sold by
Barrington Ronnie and Barrington Shirley
Bought by
Osborn Kenneth James and Osborn Wynona Kaye
Purchase Details
Closed on
Aug 29, 2005
Sold by
Dahlberg Alan and Dahlberg Carol S
Bought by
Barrington Ronnie and Barrington Shirley
Purchase Details
Closed on
Jan 29, 2003
Sold by
Choice Homes Inc
Bought by
Osborn Real Estate Investments Llc
Purchase Details
Closed on
Oct 16, 2002
Sold by
Jasper Development Ltd
Bought by
Osborn Real Estate Investments Llc
Purchase Details
Closed on
Nov 2, 2001
Sold by
Granbury Medical Properties
Bought by
Osborn Real Estate Investments Llc
Create a Home Valuation Report for This Property
The Home Valuation Report is an in-depth analysis detailing your home's value as well as a comparison with similar homes in the area
Home Values in the Area
Average Home Value in this Area
Purchase History
| Date | Buyer | Sale Price | Title Company |
|---|---|---|---|
| Osborn Real Estate Investments Llc | -- | Attorney | |
| Osborn Kenneth James | -- | Central Texas Title | |
| Barrington Ronnie | -- | Central Texas Title | |
| Osborn Real Estate Investments Llc | -- | -- | |
| Osborn Real Estate Investments Llc | -- | -- | |
| Osborn Real Estate Investments Llc | -- | -- |
Source: Public Records
Tax History Compared to Growth
Tax History
| Year | Tax Paid | Tax Assessment Tax Assessment Total Assessment is a certain percentage of the fair market value that is determined by local assessors to be the total taxable value of land and additions on the property. | Land | Improvement |
|---|---|---|---|---|
| 2025 | $4,573 | $288,700 | $30,000 | $258,700 |
| 2024 | $4,615 | $288,130 | $30,000 | $258,130 |
| 2023 | $4,666 | $291,280 | $30,000 | $261,280 |
| 2022 | $4,404 | $257,430 | $25,000 | $232,430 |
| 2021 | $3,581 | $185,400 | $25,000 | $160,400 |
| 2020 | $3,392 | $173,720 | $25,000 | $148,720 |
| 2019 | $3,381 | $166,960 | $25,000 | $141,960 |
| 2018 | $3,048 | $150,510 | $25,000 | $125,510 |
| 2017 | $2,840 | $137,200 | $20,000 | $117,200 |
| 2016 | $2,724 | $131,620 | $20,000 | $111,620 |
| 2015 | $2,567 | $128,200 | $20,000 | $108,200 |
| 2014 | $2,567 | $124,950 | $20,000 | $104,950 |
Source: Public Records
Map
Nearby Homes
- 4816 Topaz Ln
- 4823 Topaz Ln
- 229 Jacinth Ln
- 4726 Topaz Ln
- 4203 Jasper Ln
- 4712 Topaz Ln
- 712 Rolling Terrace Cir
- 5284 E Us Highway 377
- 422 Woodcreek Ct
- 2401 True Grit Way
- 428 Penny Ct
- 109 Seabiscuit Ct
- 105 Seabiscuit Ct
- 101 Seabiscuit Ct
- 204 Affirmed Ct
- 205 Affirmed Ct
- 209 Affirmed Ct
- 4400 Kristy Ct
- 312 Gallant Man Ct
- 308 Gallant Man Ct