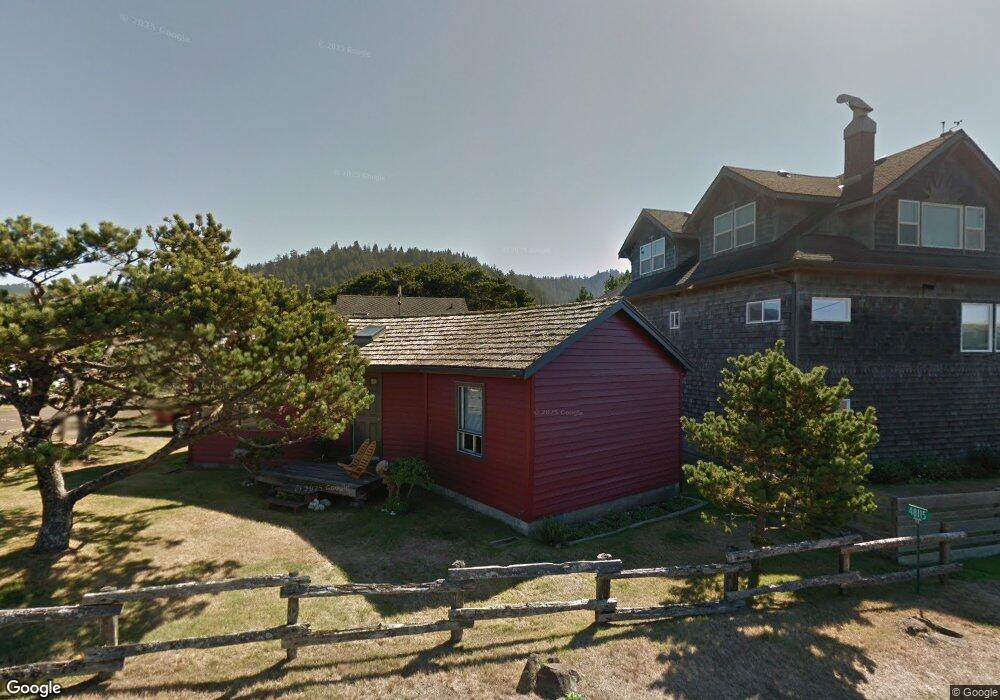
48115 Breakers Blvd Neskowin, OR 97149
Estimated Value: $480,442 - $693,000
2
Beds
1
Bath
672
Sq Ft
$869/Sq Ft
Est. Value
About This Home
This home is located at 48115 Breakers Blvd, Neskowin, OR 97149 and is currently estimated at $583,861, approximately $868 per square foot. 48115 Breakers Blvd is a home with nearby schools including Nestucca K-8 School and Nestucca High School.
Ownership History
Date
Name
Owned For
Owner Type
Purchase Details
Closed on
May 4, 2023
Sold by
David F Riley And Susan O Riley Living T
Bought by
Riley Irrevocable Trust
Current Estimated Value
Purchase Details
Closed on
Jan 9, 2016
Sold by
Riley Susan O
Bought by
Riley David F and Riley Susan O
Create a Home Valuation Report for This Property
The Home Valuation Report is an in-depth analysis detailing your home's value as well as a comparison with similar homes in the area
Home Values in the Area
Average Home Value in this Area
Purchase History
| Date | Buyer | Sale Price | Title Company |
|---|---|---|---|
| Riley Irrevocable Trust | -- | None Listed On Document | |
| Riley David F | -- | None Available |
Source: Public Records
Tax History Compared to Growth
Tax History
| Year | Tax Paid | Tax Assessment Tax Assessment Total Assessment is a certain percentage of the fair market value that is determined by local assessors to be the total taxable value of land and additions on the property. | Land | Improvement |
|---|---|---|---|---|
| 2024 | $2,363 | $191,030 | $105,910 | $85,120 |
| 2023 | $2,368 | $185,470 | $102,830 | $82,640 |
| 2022 | $2,284 | $180,070 | $99,840 | $80,230 |
| 2021 | $2,220 | $174,830 | $96,940 | $77,890 |
| 2020 | $2,165 | $169,740 | $94,120 | $75,620 |
| 2019 | $2,119 | $164,800 | $91,380 | $73,420 |
| 2018 | $1,957 | $160,000 | $88,720 | $71,280 |
| 2017 | $1,762 | $155,340 | $86,140 | $69,200 |
| 2016 | $1,623 | $150,820 | $83,640 | $67,180 |
| 2015 | $1,677 | $146,430 | $81,210 | $65,220 |
| 2014 | $1,637 | $142,170 | $78,850 | $63,320 |
| 2013 | -- | $138,030 | $76,550 | $61,480 |
Source: Public Records
Map
Nearby Homes
- 48250 Hawk St
- 6600 Schoolhouse Rd
- 48988 Highway 101 S Unit 338
- 48988 Highway 101 S Unit 137-F
- 4850 Schoolhouse Rd
- 49002 S Hwy Unit B share B
- 49002 U S 101 S
- 4800 Blk Valley View Dr Tl 4000
- 48988 S Highway 101 (#338) Hwy
- 0 Hilltop Ln Unit 704164730
- 49400 Blk Nescove Dr Tl303
- V/L 6500 Hill Crest Dr
- 0 S Fairway Rd Unit 653571953
- 0 S Fairway Rd Unit 315656510
- 0 S Fairway Rd Unit 454757988
- TL 3102 S Beach Rd
- 3102 S Beach Rd
- 49750 Nescove Dr
- 46995 Beach Crest Dr
- 49855 Seasand Rd
- 4325 Sheridan Ave
- 4320 Amity Ave
- 48160 Breakers Blvd
- 4290 Amity Ave
- 4320 Sheridan Ave
- 48110 Breakers Blvd
- 4350 Amity Ave
- 4355 Sheridan (Next To)
- 4355 Sheridan Ave
- 4350 Sheridan Ave
- 48050 Breakers Unit 11&11a
- 48225 Breakers Blvd
- 48065 Breakers Blvd
- 48060 Breakers Blvd
- 48060 Breakers Blvd Unit 3
- 48060 Breakers #8 Blvd
- 48060 Breakers Blvd Unit 8
- 48060 Breakers Blvd Unit 2
- 48060 Breakers Blvd Unit 4
- 48060 Breakers Blvd Unit 10