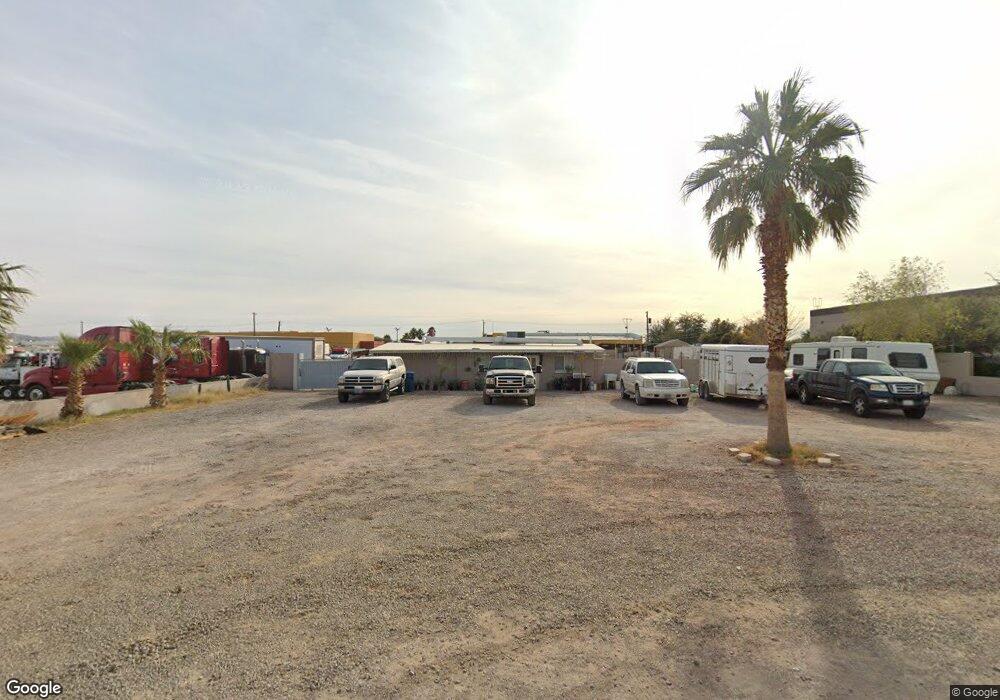
4812 Holt Ave Las Vegas, NV 89115
Estimated Value: $229,000 - $407,000
1
Bed
1
Bath
624
Sq Ft
$552/Sq Ft
Est. Value
About This Home
This home is located at 4812 Holt Ave, Las Vegas, NV 89115 and is currently estimated at $344,269, approximately $551 per square foot. 4812 Holt Ave is a home located in Clark County with nearby schools including Ann Lynch Elementary School, Mario C. & Joanne Monaco Middle School, and Sunrise Mountain High School.
Ownership History
Date
Name
Owned For
Owner Type
Purchase Details
Closed on
Jul 11, 2001
Sold by
Ceballos Imelda
Bought by
Ceballos Enrique
Current Estimated Value
Home Financials for this Owner
Home Financials are based on the most recent Mortgage that was taken out on this home.
Original Mortgage
$88,200
Outstanding Balance
$34,286
Interest Rate
7.26%
Mortgage Type
Seller Take Back
Estimated Equity
$309,983
Purchase Details
Closed on
Apr 24, 2000
Sold by
Bertolo Carlos
Bought by
Savage Ron
Purchase Details
Closed on
Apr 30, 1999
Sold by
Howard Bonnie L
Bought by
Bartolo Carlos
Home Financials for this Owner
Home Financials are based on the most recent Mortgage that was taken out on this home.
Original Mortgage
$60,000
Interest Rate
6.98%
Mortgage Type
Seller Take Back
Create a Home Valuation Report for This Property
The Home Valuation Report is an in-depth analysis detailing your home's value as well as a comparison with similar homes in the area
Home Values in the Area
Average Home Value in this Area
Purchase History
| Date | Buyer | Sale Price | Title Company |
|---|---|---|---|
| Ceballos Enrique | -- | United Title | |
| Ceballos Enrique | $98,000 | United Title | |
| Savage Ron | $60,000 | -- | |
| Bartolo Carlos | $60,000 | Fidelity National Title Agen |
Source: Public Records
Mortgage History
| Date | Status | Borrower | Loan Amount |
|---|---|---|---|
| Open | Ceballos Enrique | $88,200 | |
| Previous Owner | Bartolo Carlos | $60,000 |
Source: Public Records
Tax History Compared to Growth
Tax History
| Year | Tax Paid | Tax Assessment Tax Assessment Total Assessment is a certain percentage of the fair market value that is determined by local assessors to be the total taxable value of land and additions on the property. | Land | Improvement |
|---|---|---|---|---|
| 2025 | $1,325 | $107,774 | $97,696 | $10,078 |
| 2024 | $1,288 | $107,774 | $97,696 | $10,078 |
| 2023 | $1,288 | $100,710 | $91,589 | $9,121 |
| 2022 | $1,346 | $75,246 | $67,166 | $8,080 |
| 2021 | $1,251 | $65,496 | $57,939 | $7,557 |
| 2020 | $914 | $62,327 | $54,954 | $7,373 |
| 2019 | $856 | $62,033 | $54,954 | $7,079 |
| 2018 | $817 | $35,553 | $28,902 | $6,651 |
| 2017 | $957 | $32,644 | $26,052 | $6,592 |
| 2016 | $1,018 | $30,816 | $24,424 | $6,392 |
| 2015 | $1,015 | $25,197 | $18,996 | $6,201 |
| 2014 | $992 | $24,958 | $18,996 | $5,962 |
Source: Public Records
Map
Nearby Homes
- 4650 E Lake Mead Blvd Unit 20
- 4650 E Lake Mead Blvd Unit 123
- 4650 E Lake Mead Blvd Unit 120
- 4650 E Lake Mead Blvd Unit 82
- 4650 E Lake Mead Blvd Unit 95
- 4650 E Lake Mead Blvd Unit 65
- 4650 E Lake Mead Blvd Unit 73
- 4650 E Lake Mead Blvd Unit 35
- 4650 E Lake Mead Blvd Unit 113
- 4182 E Lake Mead Blvd
- 1919 Verde Mirada Dr
- 4639 Poetic Author Ave
- 4549 Morton Grove Ave
- 1739 N Lamont St
- 4526 Morton Grove Ave
- 2150 Dolly Ln
- 1952 Metamora St
- 2130 Trebbiano Way
- 4487 E Lake Mead Blvd Unit 32
- 4487 E Lake Mead Blvd Unit 55
- 4796 E Lake Mead Blvd
- 4747 Holt Ave
- 4907 Holt Ave
- 4818 Holt Ave
- 4775 Holt Ave
- 4928 E Lake Mead Blvd
- 0 Holt
- 4929 Holt Ave
- 4753 Holt Ave
- 4745 Holt Ave
- 2034 Marion Dr Unit C
- 2034 Marion Dr
- 4951 Holt Ave
- 4820 Holt
- 4752 Holt Ave
- 2111 Oceanus Ln
- 4725 Holt Ave
- 4973 Holt Ave
- 2121 Oceanus Ln Unit 2
- 2121 Oceanus Ln Unit 3