Estimated Value: $442,000 - $546,000
--
Bed
4
Baths
2,162
Sq Ft
$226/Sq Ft
Est. Value
About This Home
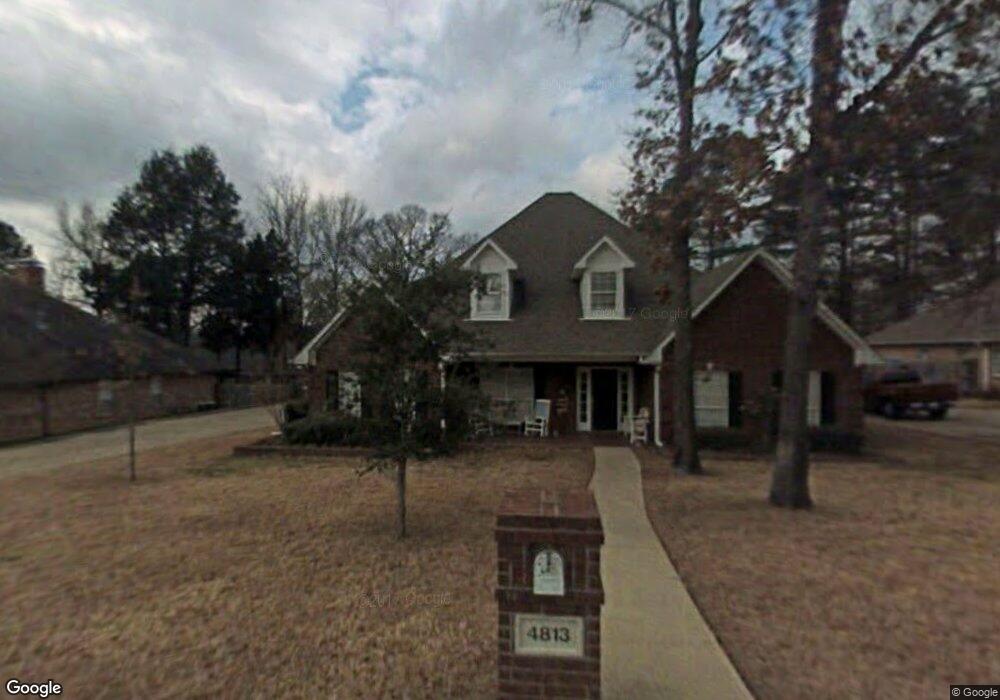
This home is located at 4813 Hallye Ln, Tyler, TX 75703 and is currently estimated at $489,316, approximately $226 per square foot. 4813 Hallye Ln is a home located in Smith County with nearby schools including Rice Elementary School, Hubbard Middle School, and Tyler Legacy High School.
Ownership History
Date
Name
Owned For
Owner Type
Purchase Details
Closed on
Jan 29, 2021
Sold by
James David L and James Jennifer E
Bought by
Reeves Patrick Kelly and Reeves Lani L
Current Estimated Value
Home Financials for this Owner
Home Financials are based on the most recent Mortgage that was taken out on this home.
Original Mortgage
$280,000
Outstanding Balance
$249,149
Interest Rate
2.67%
Mortgage Type
New Conventional
Estimated Equity
$240,167
Purchase Details
Closed on
Sep 22, 2017
Sold by
Mccoy Clifford A and Mccoy Cathey S
Bought by
James David L and James Jennifer E
Home Financials for this Owner
Home Financials are based on the most recent Mortgage that was taken out on this home.
Original Mortgage
$254,400
Interest Rate
3.4%
Mortgage Type
Adjustable Rate Mortgage/ARM
Create a Home Valuation Report for This Property
The Home Valuation Report is an in-depth analysis detailing your home's value as well as a comparison with similar homes in the area
Home Values in the Area
Average Home Value in this Area
Purchase History
| Date | Buyer | Sale Price | Title Company |
|---|---|---|---|
| Reeves Patrick Kelly | -- | None Available | |
| James David L | -- | None Available |
Source: Public Records
Mortgage History
| Date | Status | Borrower | Loan Amount |
|---|---|---|---|
| Open | Reeves Patrick Kelly | $280,000 | |
| Previous Owner | James David L | $254,400 |
Source: Public Records
Tax History Compared to Growth
Tax History
| Year | Tax Paid | Tax Assessment Tax Assessment Total Assessment is a certain percentage of the fair market value that is determined by local assessors to be the total taxable value of land and additions on the property. | Land | Improvement |
|---|---|---|---|---|
| 2025 | $6,632 | $416,475 | $52,278 | $364,197 |
| 2024 | $6,632 | $449,691 | $77,175 | $372,516 |
| 2023 | $6,621 | $452,175 | $77,175 | $375,000 |
| 2022 | $7,860 | $401,195 | $60,858 | $340,337 |
| 2021 | $7,766 | $370,170 | $60,858 | $309,312 |
| 2020 | $7,397 | $345,671 | $60,858 | $284,813 |
| 2019 | $7,051 | $322,468 | $44,100 | $278,368 |
| 2018 | $6,907 | $317,591 | $44,100 | $273,491 |
| 2017 | $7,420 | $347,562 | $44,100 | $303,462 |
| 2016 | $7,098 | $332,476 | $44,100 | $288,376 |
| 2015 | $6,380 | $322,316 | $44,100 | $278,216 |
| 2014 | $6,380 | $313,215 | $44,100 | $269,115 |
Source: Public Records
Map
Nearby Homes
- 5106 Cloverdale Dr
- 704 Paloma St
- 7434 Waterview Square
- 6052 N Park Central Ct
- 418 Boyd Ln
- 601 Carriage Dr
- 429 Holiday Ln
- 842 Carriage Dr
- 802 Carriage Dr
- 1107 Larkspur Ln
- 709 Top Hill Dr
- 608 Top Hill Dr
- 717 Meadow Creek Dr
- 5401 Hollytree Dr
- 5401 Hollytree Dr Unit 1002
- 1202 Rice Rd
- 4001 Darrell Ln
- 14237 County Road 192
- 14195 County Road 192
- 14245 County Road 192
- 4813 Hallye Ln
- 4813 4813 Hallye
- 4819 4819 Hallye Ln
- 4807 Hallye Ln
- 4819 Hallye Ln
- 4807 4807 Hallye
- 4814 Barclay Dr
- 4820 Barclay Dr
- 4808 Barclay Dr
- 4808 4808 Barclay Dr
- 4814 Hallye Ln
- 4808 4808 Hallye Ln
- 4820 4820 Barclay Dr
- 4801 Hallye Ln
- 4808 Hallye Ln
- 4825 Hallye Ln
- 4820 Hallye Ln
- 4802 Barclay Dr
- 4826 Barclay Dr
- 4826 Hallye Ln