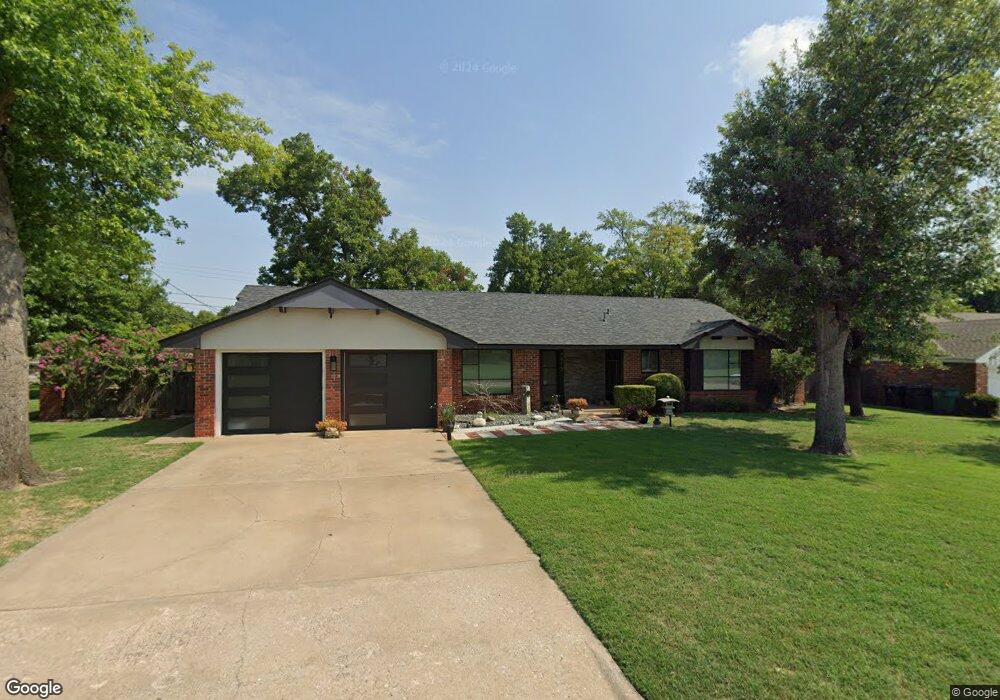
4813 NW 32nd St Oklahoma City, OK 73122
Windsor Hills NeighborhoodEstimated Value: $241,000 - $324,000
3
Beds
3
Baths
1,742
Sq Ft
$154/Sq Ft
Est. Value
About This Home
This home is located at 4813 NW 32nd St, Oklahoma City, OK 73122 and is currently estimated at $268,963, approximately $154 per square foot. 4813 NW 32nd St is a home located in Oklahoma County with nearby schools including Windsor Hills Elementary School, Mayfield Middle School, and Putnam City West High School.
Ownership History
Date
Name
Owned For
Owner Type
Purchase Details
Closed on
Apr 24, 2009
Sold by
First Gunn Corp
Bought by
Holder Henry Victor
Current Estimated Value
Home Financials for this Owner
Home Financials are based on the most recent Mortgage that was taken out on this home.
Original Mortgage
$132,400
Outstanding Balance
$83,248
Interest Rate
4.84%
Mortgage Type
Purchase Money Mortgage
Estimated Equity
$185,715
Purchase Details
Closed on
Sep 21, 2007
Sold by
Smith Lori G and Smith Brian L
Bought by
First Gunn Corp
Purchase Details
Closed on
Mar 27, 2007
Sold by
Carr Marian E and Estate Of James Donald Carr
Bought by
Smith Lori G
Purchase Details
Closed on
Dec 21, 2006
Sold by
Carr Marian E and Carr James D
Bought by
Carr James D
Purchase Details
Closed on
Jan 27, 2005
Sold by
Carr James D and Carr Marian E
Bought by
Carr James D and Carr Marian E
Purchase Details
Closed on
Oct 10, 2002
Sold by
Carr James D and Carr Marian E
Bought by
The James D & Marian E Carr Revocable Tr
Create a Home Valuation Report for This Property
The Home Valuation Report is an in-depth analysis detailing your home's value as well as a comparison with similar homes in the area
Home Values in the Area
Average Home Value in this Area
Purchase History
| Date | Buyer | Sale Price | Title Company |
|---|---|---|---|
| Holder Henry Victor | $165,500 | American Eagle Title Ins Co | |
| First Gunn Corp | $117,500 | None Available | |
| Smith Lori G | $117,500 | Capitol Abstract & Title Co | |
| Carr James D | -- | None Available | |
| Carr James D | -- | Capitol Abstract & Title | |
| Carr James D | -- | Capitol Abstract & Title | |
| The James D & Marian E Carr Revocable Tr | -- | -- |
Source: Public Records
Mortgage History
| Date | Status | Borrower | Loan Amount |
|---|---|---|---|
| Open | Holder Henry Victor | $132,400 |
Source: Public Records
Tax History Compared to Growth
Tax History
| Year | Tax Paid | Tax Assessment Tax Assessment Total Assessment is a certain percentage of the fair market value that is determined by local assessors to be the total taxable value of land and additions on the property. | Land | Improvement |
|---|---|---|---|---|
| 2024 | $2,412 | $21,408 | $3,673 | $17,735 |
| 2023 | $2,412 | $20,785 | $3,062 | $17,723 |
| 2022 | $2,367 | $20,178 | $3,358 | $16,820 |
| 2021 | $2,272 | $19,591 | $3,774 | $15,817 |
| 2020 | $2,193 | $19,021 | $3,961 | $15,060 |
| 2019 | $2,094 | $18,467 | $3,412 | $15,055 |
| 2018 | $2,032 | $17,930 | $0 | $0 |
| 2017 | $1,984 | $17,503 | $3,532 | $13,971 |
| 2016 | $1,920 | $16,994 | $3,607 | $13,387 |
| 2015 | $1,889 | $16,554 | $3,696 | $12,858 |
| 2014 | $1,773 | $16,177 | $3,696 | $12,481 |
Source: Public Records
Map
Nearby Homes
- 4908 NW 32nd St
- 4900 NW 34th St
- 4901 NW 34th St
- 3508 N Ann Arbor Place
- 3408 N Preston Dr
- 4612 NW 33rd Terrace
- 3401 N Preston Dr
- 4612 NW 33rd Dr
- 4621 NW 34th St
- 4997 NW 30th Place
- 4608 NW 34th St
- 5716 NW 31st St
- 5717 NW 31st Terrace
- 2900 N Windsor Blvd
- 5737 NW 31st St
- 4917 NW 26th St
- 2805 Tudor Rd
- 5825 NW 34th St
- 2704 N Harvard Ave
- 4838 NW 26th St
- 4809 NW 32nd St
- 4812 NW 33rd St
- 4808 NW 33rd St
- 4805 NW 32nd St
- 4812 NW 32nd St
- 4901 NW 32nd St
- 4804 NW 33rd St
- 4808 NW 32nd St
- 4900 NW 33rd St
- 4900 NW 32nd St
- 4800 NW 33rd St
- 4801 NW 32nd St
- 4905 NW 32nd St
- 4813 NW 33rd St
- 4819 NW 31st St
- 4809 NW 33rd St
- 4904 NW 33rd St
- 4815 NW 31st St
- 4904 NW 32nd St
- 4805 NW 33rd St