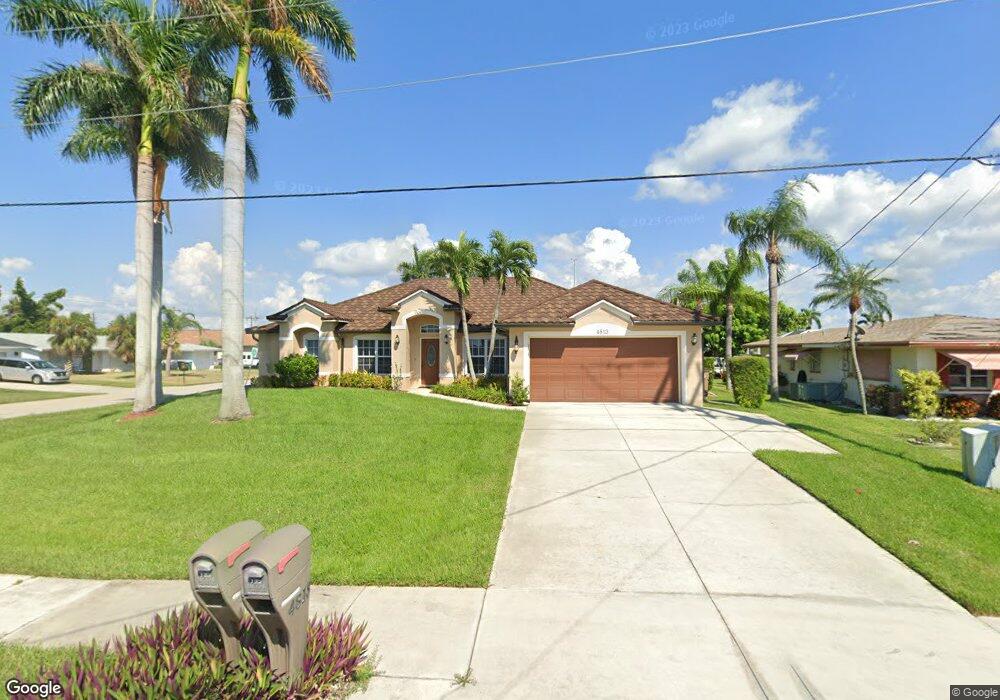
4813 Pelican Blvd Unit 3 Cape Coral, FL 33914
Pelican NeighborhoodEstimated Value: $676,496 - $786,000
4
Beds
2
Baths
3,033
Sq Ft
$239/Sq Ft
Est. Value
About This Home
This home is located at 4813 Pelican Blvd Unit 3, Cape Coral, FL 33914 and is currently estimated at $724,624, approximately $238 per square foot. 4813 Pelican Blvd Unit 3 is a home located in Lee County with nearby schools including Cape Elementary School, Caloosa Elementary School, and Tropic Isles Elementary School.
Ownership History
Date
Name
Owned For
Owner Type
Purchase Details
Closed on
Dec 6, 2010
Sold by
Wandrey Gary and Wandrey Mary
Bought by
King Larry and King Donna
Current Estimated Value
Purchase Details
Closed on
Jan 29, 2004
Sold by
Mercedes Homes Inc
Bought by
Wandrey Gary R and Wandrey Mary A
Home Financials for this Owner
Home Financials are based on the most recent Mortgage that was taken out on this home.
Original Mortgage
$219,000
Interest Rate
5.77%
Purchase Details
Closed on
Jun 5, 2003
Sold by
Wandrey Gary R
Bought by
Mercedes Homes Inc
Purchase Details
Closed on
Aug 20, 2002
Sold by
Robertson Donald and Robertson Judith J
Bought by
Wandrey Gary R
Purchase Details
Closed on
May 10, 2001
Sold by
Birmingham John M and Birmingham Yeay Lu
Bought by
Robertson Donald and Robertson Judith J
Home Financials for this Owner
Home Financials are based on the most recent Mortgage that was taken out on this home.
Original Mortgage
$53,900
Interest Rate
7.11%
Create a Home Valuation Report for This Property
The Home Valuation Report is an in-depth analysis detailing your home's value as well as a comparison with similar homes in the area
Home Values in the Area
Average Home Value in this Area
Purchase History
| Date | Buyer | Sale Price | Title Company |
|---|---|---|---|
| King Larry | $275,000 | Florida Title & Escrow Group | |
| Wandrey Gary R | $211,800 | -- | |
| Mercedes Homes Inc | -- | -- | |
| Wandrey Gary R | $185,000 | -- | |
| Robertson Donald | $60,000 | -- |
Source: Public Records
Mortgage History
| Date | Status | Borrower | Loan Amount |
|---|---|---|---|
| Previous Owner | Wandrey Gary R | $219,000 | |
| Previous Owner | Robertson Donald | $53,900 |
Source: Public Records
Tax History Compared to Growth
Tax History
| Year | Tax Paid | Tax Assessment Tax Assessment Total Assessment is a certain percentage of the fair market value that is determined by local assessors to be the total taxable value of land and additions on the property. | Land | Improvement |
|---|---|---|---|---|
| 2025 | $6,343 | $399,578 | -- | -- |
| 2024 | $6,169 | $388,317 | -- | -- |
| 2023 | $6,169 | $377,007 | $0 | $0 |
| 2022 | $5,863 | $366,026 | $0 | $0 |
| 2021 | $6,087 | $409,873 | $220,153 | $189,720 |
| 2020 | $6,208 | $350,459 | $214,000 | $136,459 |
| 2019 | $6,102 | $346,137 | $0 | $0 |
| 2018 | $6,110 | $339,683 | $0 | $0 |
| 2017 | $6,096 | $332,696 | $210,000 | $122,696 |
| 2016 | $6,389 | $345,757 | $214,215 | $131,542 |
| 2015 | $6,965 | $327,498 | $179,684 | $147,814 |
| 2014 | $7,643 | $359,906 | $156,609 | $203,297 |
| 2013 | -- | $315,414 | $119,071 | $196,343 |
Source: Public Records
Map
Nearby Homes
- 335 SW 48th Terrace
- 328 Cape Coral Pkwy W Unit 1
- 4907 Pelican Blvd
- 4827 SW 3rd Ave
- 4820 SW 2nd Place
- 237 SW 48th Terrace
- 309 Cape coral Cape Coral Pkwy W Unit 206
- 333 SW 47th Terrace
- 317 SW 47th Terrace
- 403 SW 47th Terrace Unit 203
- 227 SW 48th Terrace
- 4935 SW 3rd Ave
- 430 SW 47th Terrace
- 503 Cape Coral Pkwy W Unit 104
- 425 SW 47th Terrace Unit 5-8
- 218 SW 47th Terrace
- 402 SW 46th Terrace
- 4927 SW 2nd Ave
- 505 SW 47th Terrace Unit 104
- 4902 SW 5th Place
- 4817 Pelican Blvd
- 4821 Pelican Blvd
- 331 SW 48th Terrace
- 4812 SW 3rd Ave Unit 3
- 327 SW 48th Terrace
- 4816 SW 3rd Ave
- 4825 Pelican Blvd
- 4816 Pelican Blvd
- 4820 SW 3rd Ave
- 4812 Pelican Blvd
- 4820 Pelican Blvd
- 323 SW 48th Terrace
- 334 Cape Coral Pkwy W
- 334 Cape Coral Pkwy W Unit 2
- 334 Cape Coral Pkwy W Unit 1
- 334 Cape Coral Pkwy W Unit 1-2
- 328 Cape Coral Pkwy W Unit 3
- 328 Cape Coral Pkwy W Unit 1, 3
- 328 Cape Coral Pkwy W
- 328 Cape Coral Pkwy W Unit 4