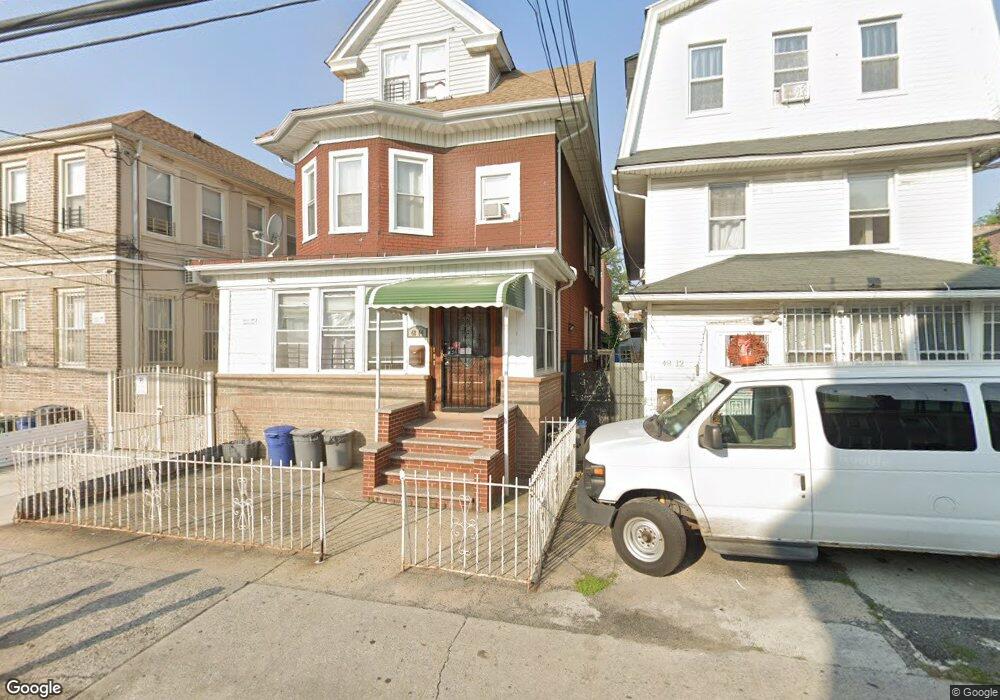
4814 93rd St Elmhurst, NY 11373
Elmhurst NeighborhoodEstimated Value: $1,590,000 - $1,734,000
Studio
--
Bath
3,064
Sq Ft
$544/Sq Ft
Est. Value
About This Home
This home is located at 4814 93rd St, Elmhurst, NY 11373 and is currently estimated at $1,667,000, approximately $544 per square foot. 4814 93rd St is a home located in Queens County with nearby schools including P.S. 13 Clement C Moore, I.S. 093 Ridgewood, and Joseph F. Quinn Intermediate School 77.
Ownership History
Date
Name
Owned For
Owner Type
Purchase Details
Closed on
May 12, 1999
Sold by
Ahmed Fazila
Bought by
Ahmed Mir Monir U Din
Current Estimated Value
Home Financials for this Owner
Home Financials are based on the most recent Mortgage that was taken out on this home.
Original Mortgage
$306,000
Outstanding Balance
$77,822
Interest Rate
6.85%
Estimated Equity
$1,589,178
Purchase Details
Closed on
Mar 4, 1996
Sold by
Hossain Mohammed and Ahmed Fazila
Bought by
Ahmed Fazila
Home Financials for this Owner
Home Financials are based on the most recent Mortgage that was taken out on this home.
Original Mortgage
$218,000
Interest Rate
7.77%
Purchase Details
Closed on
Jul 21, 1995
Sold by
Chen Frank L
Bought by
Hossain Mohammed and Ahmed Fazila
Home Financials for this Owner
Home Financials are based on the most recent Mortgage that was taken out on this home.
Original Mortgage
$218,700
Interest Rate
7.48%
Create a Home Valuation Report for This Property
The Home Valuation Report is an in-depth analysis detailing your home's value as well as a comparison with similar homes in the area
Home Values in the Area
Average Home Value in this Area
Purchase History
| Date | Buyer | Sale Price | Title Company |
|---|---|---|---|
| Ahmed Mir Monir U Din | $340,000 | First American Title Ins Co | |
| Ahmed Fazila | $44,000 | -- | |
| Hossain Mohammed | $243,000 | First American Title Ins Co |
Source: Public Records
Mortgage History
| Date | Status | Borrower | Loan Amount |
|---|---|---|---|
| Open | Ahmed Mir Monir U Din | $306,000 | |
| Previous Owner | Ahmed Fazila | $218,000 | |
| Previous Owner | Hossain Mohammed | $218,700 |
Source: Public Records
Tax History
| Year | Tax Paid | Tax Assessment Tax Assessment Total Assessment is a certain percentage of the fair market value that is determined by local assessors to be the total taxable value of land and additions on the property. | Land | Improvement |
|---|---|---|---|---|
| 2025 | $9,674 | $52,538 | $14,467 | $38,071 |
| 2024 | $9,686 | $49,565 | $12,821 | $36,744 |
| 2018 | $8,122 | $41,304 | $12,083 | $29,221 |
| 2017 | $7,807 | $39,770 | $13,118 | $26,652 |
| 2016 | $7,211 | $39,770 | $13,118 | $26,652 |
| 2015 | $4,305 | $36,485 | $21,777 | $14,708 |
| 2014 | $4,305 | $34,420 | $24,661 | $9,759 |
Source: Public Records
Map
Nearby Homes
- 93-10 50th Ave
- 94-14 Corona Ave
- 91-23 Corona Ave Unit 2A
- 91-23 Corona Ave Unit 3F
- 91-23 Corona Ave Unit 4F
- 91-23 Corona Ave Unit 2E
- 91-23 Corona Ave Unit 2B
- 91-23 Corona Ave Unit 6C
- 9235 51st Ave
- 90-70 51st Ave Unit 4A
- 9206 43rd Ave
- 9204 43rd Ave
- 91-02 50th Ave
- 9041 Corona Ave
- 91-16 43rd Ave
- 93-09 43rd Ave
- 9429 51st Ave
- 94-29 51st Ave
- 94-44 45th Ave
- 51-02 Junction Blvd
Your Personal Tour Guide
Ask me questions while you tour the home.