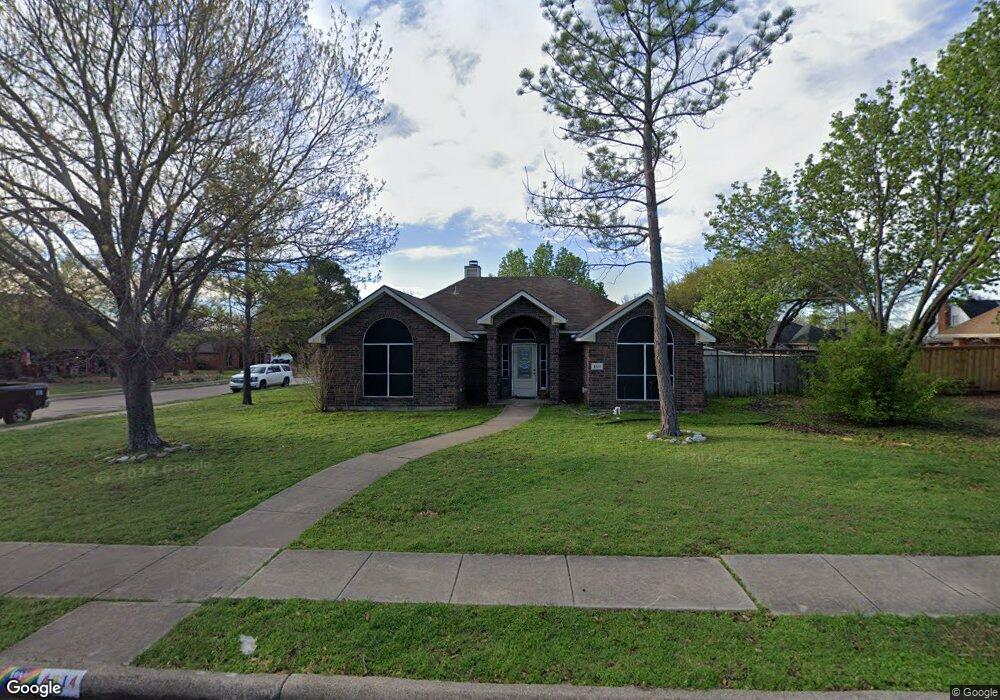
4814 Rustic Ridge Ct Sachse, TX 75048
Estimated Value: $325,000 - $372,000
3
Beds
2
Baths
1,353
Sq Ft
$261/Sq Ft
Est. Value
About This Home
This home is located at 4814 Rustic Ridge Ct, Sachse, TX 75048 and is currently estimated at $352,525, approximately $260 per square foot. 4814 Rustic Ridge Ct is a home located in Dallas County with nearby schools including Harmony Science Academy - Garland, Harmony School of Innovation - Garland, and Pinnacle Montessori of Sachse.
Ownership History
Date
Name
Owned For
Owner Type
Purchase Details
Closed on
Oct 26, 2017
Sold by
Hill Judith Kay and Hill Tony L
Bought by
Hohman Charlyn
Current Estimated Value
Home Financials for this Owner
Home Financials are based on the most recent Mortgage that was taken out on this home.
Original Mortgage
$215,916
Outstanding Balance
$183,355
Interest Rate
4.37%
Mortgage Type
FHA
Estimated Equity
$169,170
Purchase Details
Closed on
Jul 26, 2002
Sold by
Stinehour Robert Mikel
Bought by
Hill Tony L
Home Financials for this Owner
Home Financials are based on the most recent Mortgage that was taken out on this home.
Original Mortgage
$121,099
Interest Rate
6.62%
Mortgage Type
FHA
Purchase Details
Closed on
Jan 9, 2002
Sold by
Stinehour Leanne T Sherwood
Bought by
Stinehour Robert M
Create a Home Valuation Report for This Property
The Home Valuation Report is an in-depth analysis detailing your home's value as well as a comparison with similar homes in the area
Home Values in the Area
Average Home Value in this Area
Purchase History
| Date | Buyer | Sale Price | Title Company |
|---|---|---|---|
| Hohman Charlyn | -- | Capital Title | |
| Hill Tony L | -- | -- | |
| Stinehour Robert M | -- | -- |
Source: Public Records
Mortgage History
| Date | Status | Borrower | Loan Amount |
|---|---|---|---|
| Open | Hohman Charlyn | $215,916 | |
| Previous Owner | Hill Tony L | $121,099 | |
| Closed | Stinehour Robert M | $0 |
Source: Public Records
Tax History Compared to Growth
Tax History
| Year | Tax Paid | Tax Assessment Tax Assessment Total Assessment is a certain percentage of the fair market value that is determined by local assessors to be the total taxable value of land and additions on the property. | Land | Improvement |
|---|---|---|---|---|
| 2025 | $5,378 | $330,000 | $75,000 | $255,000 |
| 2024 | $5,378 | $330,000 | $75,000 | $255,000 |
| 2023 | $5,378 | $361,780 | $60,000 | $301,780 |
| 2022 | $6,579 | $274,970 | $60,000 | $214,970 |
| 2021 | $5,842 | $227,000 | $50,000 | $177,000 |
| 2020 | $6,534 | $249,750 | $50,000 | $199,750 |
| 2019 | $6,384 | $225,050 | $36,000 | $189,050 |
| 2018 | $6,445 | $225,050 | $36,000 | $189,050 |
| 2017 | $5,267 | $183,390 | $36,000 | $147,390 |
| 2016 | $4,762 | $165,800 | $30,000 | $135,800 |
| 2015 | $3,176 | $131,640 | $20,000 | $111,640 |
| 2014 | $3,176 | $131,640 | $20,000 | $111,640 |
Source: Public Records
Map
Nearby Homes
- 4133 Lone Elm St
- 4609 Hunters Ridge Dr
- 5207 Seth Ave
- 4404 Coldbrook Ln
- 4819 Jackson Meadows Dr
- 5115 Willow Bend Ln
- 3731 Frost St
- 3610 Pacific Way
- 3602 Pacific Way
- 4505 Merritt Rd
- 5111 Live Oak Dr
- 5159 Willow Bend Ln
- 3403 Scotsman Rd
- 3505 Central Blvd
- 5426 Depot Dr
- 5306 Waterloo Dr
- 3821 Red Oak St
- 4812 Riverbirch Dr
- 3322 Scotsman Rd
- 4008 Leigh Ct
- 4812 Rustic Ridge Ct
- 4815 Hunters Ridge Dr
- 4112 Emerson Way
- 4809 Hunters Ridge Dr
- 4815 Rustic Ridge Ct
- 4108 Emerson Way
- 4806 Rustic Ridge Ct
- 4811 Rustic Ridge Ct
- 4819 Rustic Ridge Ct
- 4116 Emerson Way
- 4104 Emerson Way
- 4805 Hunters Ridge Dr
- 4807 Rustic Ridge Ct
- 4720 Rustic Ridge Ct
- 4816 Hunters Ridge Dr
- 4215 Martha Ave
- 4215 Martha Ave
- 4900 Maple Shade Ave
- 4209 Martha Ave
- 4904 Maple Shade Ave