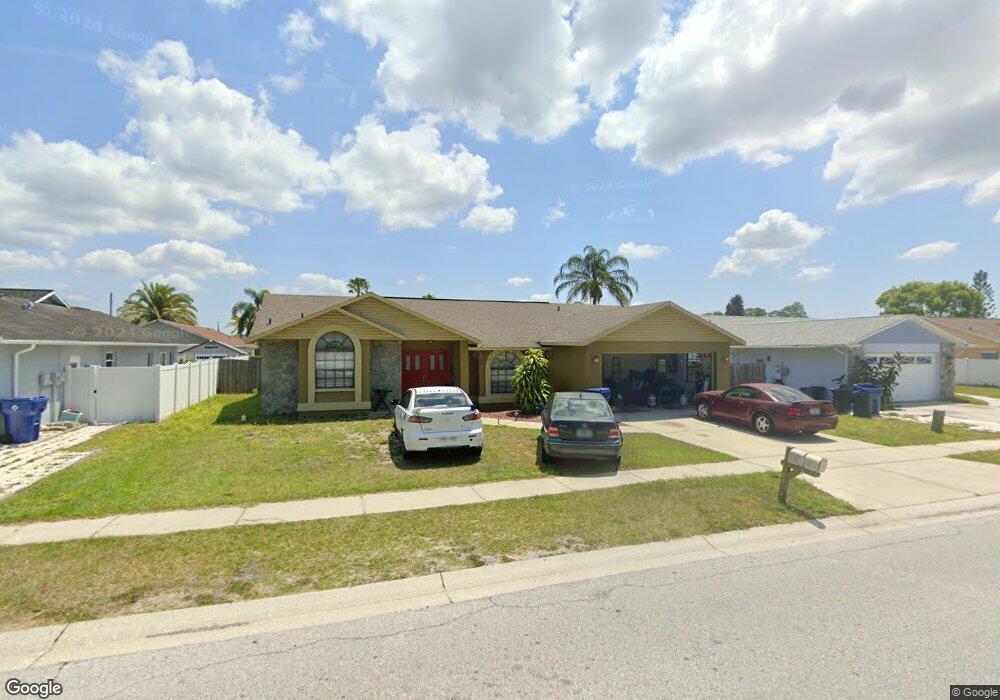
4814 Weasel Dr New Port Richey, FL 34653
South New Port Richey NeighborhoodEstimated Value: $347,000 - $406,000
4
Beds
3
Baths
2,458
Sq Ft
$153/Sq Ft
Est. Value
About This Home
This home is located at 4814 Weasel Dr, New Port Richey, FL 34653 and is currently estimated at $376,928, approximately $153 per square foot. 4814 Weasel Dr is a home located in Pasco County with nearby schools including Deer Park Elementary School, River Ridge High School, and River Ridge Middle School.
Ownership History
Date
Name
Owned For
Owner Type
Purchase Details
Closed on
Dec 6, 2016
Sold by
Freo Florida Llc
Bought by
Progress Residential 2016 & 2 Borrower Llc
Current Estimated Value
Purchase Details
Closed on
Nov 1, 2016
Bought by
Progress Residental 2016-2
Purchase Details
Closed on
Jul 15, 2016
Sold by
Cappola Paul
Bought by
Freo Florida Llc
Purchase Details
Closed on
Dec 9, 2008
Sold by
Us Bank National Association Nd
Bought by
Cappola Paul
Purchase Details
Closed on
Jun 18, 2008
Sold by
Bickford James E and Bickford Geneva A
Bought by
Us Bank Na Nd
Purchase Details
Closed on
Jul 8, 2005
Sold by
West Ivan R and West Jessica C
Bought by
Bickford James E and Bickford Geneva A
Home Financials for this Owner
Home Financials are based on the most recent Mortgage that was taken out on this home.
Original Mortgage
$184,300
Interest Rate
5.54%
Mortgage Type
Fannie Mae Freddie Mac
Create a Home Valuation Report for This Property
The Home Valuation Report is an in-depth analysis detailing your home's value as well as a comparison with similar homes in the area
Home Values in the Area
Average Home Value in this Area
Purchase History
| Date | Buyer | Sale Price | Title Company |
|---|---|---|---|
| Progress Residential 2016 & 2 Borrower Llc | -- | Attorney | |
| Progress Residental 2016-2 | $100 | -- | |
| Freo Florida Llc | $147,000 | Brightline Title Llc | |
| Cappola Paul | $127,500 | None Available | |
| Us Bank Na Nd | -- | Attorney | |
| Bickford James E | $230,400 | -- |
Source: Public Records
Mortgage History
| Date | Status | Borrower | Loan Amount |
|---|---|---|---|
| Previous Owner | Bickford James E | $184,300 | |
| Closed | Bickford James E | $46,050 |
Source: Public Records
Tax History Compared to Growth
Tax History
| Year | Tax Paid | Tax Assessment Tax Assessment Total Assessment is a certain percentage of the fair market value that is determined by local assessors to be the total taxable value of land and additions on the property. | Land | Improvement |
|---|---|---|---|---|
| 2025 | $4,989 | $323,611 | $39,836 | $283,775 |
| 2024 | $4,989 | $323,924 | $39,836 | $284,088 |
| 2023 | $4,736 | $231,410 | $0 | $0 |
| 2022 | $3,821 | $264,269 | $33,264 | $231,005 |
| 2021 | $3,334 | $203,276 | $29,811 | $173,465 |
| 2020 | $3,005 | $177,574 | $25,017 | $152,557 |
| 2019 | $2,751 | $158,076 | $21,917 | $136,159 |
| 2018 | $2,638 | $150,925 | $21,917 | $129,008 |
| 2017 | $2,481 | $138,524 | $20,677 | $117,847 |
| 2016 | $2,175 | $122,628 | $17,267 | $105,361 |
| 2015 | $2,038 | $112,500 | $17,267 | $95,233 |
| 2014 | $1,833 | $102,834 | $16,337 | $86,497 |
Source: Public Records
Map
Nearby Homes
- 8110 Damara Dr
- 7838 Trail Run Loop
- 7902 Royal Hart Dr
- 7846 Royal Hart Dr
- 8041 Blue Finch Way
- 5036 Glenhurst Ln
- 4644 Sawgrass Blvd
- 4532 Whitetail Ln
- 8122 Matthew Dr
- 4420 Northampton Dr
- 8450 Royal Hart Dr
- 7803 Riverdale Dr
- 4529 Whitton Way Unit 214
- 7735 Deer Foot Dr
- 4434 Whitton Way
- 4429 Whitton Way
- 4432 Whitton Way
- 4407 Whitton Way
- 8346 Shallow Creek Ct
- 4237 Northampton Dr
- 4806 Weasel Dr
- 4822 Weasel Dr
- 4815 Swallowtail Dr
- 4807 Swallowtail Dr
- 4823 Swallowtail Dr
- 4815 Weasel Dr
- 4823 Weasel Dr
- 4807 Weasel Dr
- 4753 Swallowtail Dr
- 4751 Weasel Dr
- 4744 Weasel Dr
- 4745 Swallowtail Dr
- 8111 Tarsier Ave
- 8110 Tarsier Ave
- 4745 Weasel Dr
- 4736 Weasel Dr
- 4737 Swallowtail Dr Unit 7
- 4750 Swallowtail Dr
- 8001 Baytree Dr
- 8119 Tarsier Ave