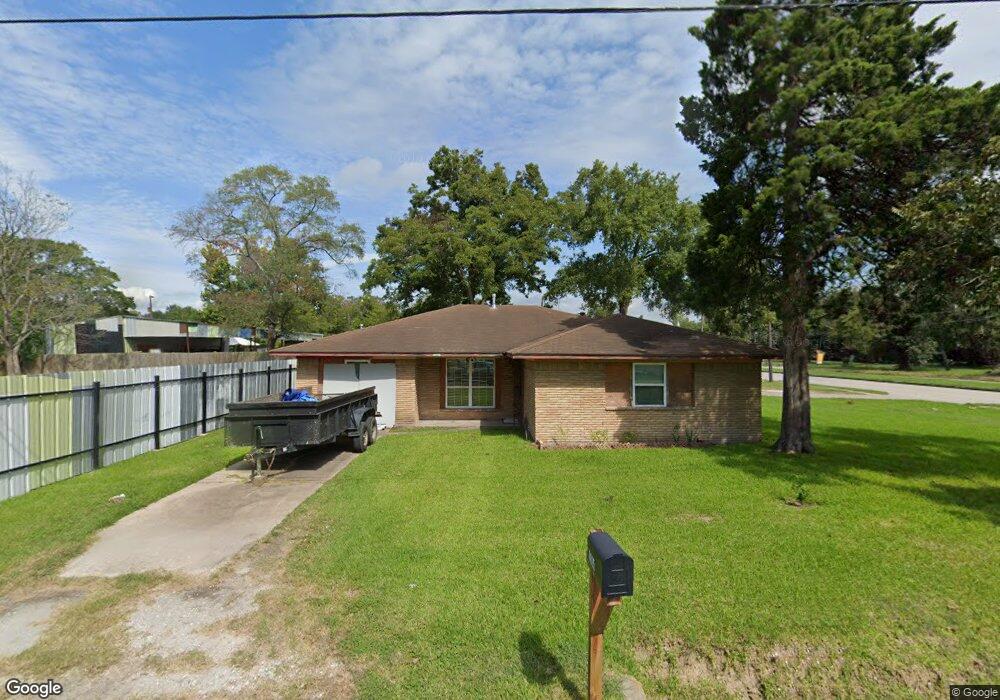
4815 Bostic St Houston, TX 77016
Trinity-Houston Gardens NeighborhoodEstimated Value: $194,000 - $265,000
3
Beds
1
Bath
1,838
Sq Ft
$130/Sq Ft
Est. Value
About This Home
This home is located at 4815 Bostic St, Houston, TX 77016 and is currently estimated at $239,074, approximately $130 per square foot. 4815 Bostic St is a home located in Harris County with nearby schools including Felix Cook Jr. Elementary School, Key Middle, and Kashmere High School.
Ownership History
Date
Name
Owned For
Owner Type
Purchase Details
Closed on
Dec 23, 2017
Sold by
Melbourne Street Llc
Bought by
Miranda Lopez Selvin E and Guzman Galvez Uwinda Noelia
Current Estimated Value
Home Financials for this Owner
Home Financials are based on the most recent Mortgage that was taken out on this home.
Original Mortgage
$81,900
Outstanding Balance
$45,610
Interest Rate
3.95%
Mortgage Type
Purchase Money Mortgage
Estimated Equity
$193,464
Purchase Details
Closed on
Nov 28, 2017
Sold by
Carter Sherneria
Bought by
Melbourne Street Llc
Home Financials for this Owner
Home Financials are based on the most recent Mortgage that was taken out on this home.
Original Mortgage
$81,900
Outstanding Balance
$45,610
Interest Rate
3.95%
Mortgage Type
Purchase Money Mortgage
Estimated Equity
$193,464
Create a Home Valuation Report for This Property
The Home Valuation Report is an in-depth analysis detailing your home's value as well as a comparison with similar homes in the area
Home Values in the Area
Average Home Value in this Area
Purchase History
| Date | Buyer | Sale Price | Title Company |
|---|---|---|---|
| Miranda Lopez Selvin E | $81,900 | None Available | |
| Melbourne Street Llc | -- | None Available |
Source: Public Records
Mortgage History
| Date | Status | Borrower | Loan Amount |
|---|---|---|---|
| Open | Miranda Lopez Selvin E | $81,900 |
Source: Public Records
Tax History Compared to Growth
Tax History
| Year | Tax Paid | Tax Assessment Tax Assessment Total Assessment is a certain percentage of the fair market value that is determined by local assessors to be the total taxable value of land and additions on the property. | Land | Improvement |
|---|---|---|---|---|
| 2025 | $5,008 | $213,549 | $77,875 | $135,674 |
| 2024 | $5,008 | $239,358 | $77,875 | $161,483 |
| 2023 | $5,008 | $224,364 | $56,875 | $167,489 |
| 2022 | $3,796 | $172,409 | $37,188 | $135,221 |
| 2021 | $3,272 | $140,371 | $21,875 | $118,496 |
| 2020 | $2,933 | $121,132 | $21,875 | $99,257 |
| 2019 | $3,065 | $121,132 | $21,875 | $99,257 |
| 2018 | $2,224 | $87,885 | $18,813 | $69,072 |
| 2017 | $2,222 | $87,885 | $18,813 | $69,072 |
| 2016 | $1,954 | $87,885 | $18,813 | $69,072 |
| 2015 | $265 | $70,245 | $26,730 | $43,515 |
| 2014 | $265 | $70,245 | $26,730 | $43,515 |
Source: Public Records
Map
Nearby Homes
- 8033 Lockwood Dr
- 4825 Weaver Rd
- 7310 Lockwood Dr
- 8617 Clarington St
- 7212 Lockwood Dr
- 0 Keeland St Unit 64861336
- 8613 Lavender St
- 7911 Wileyvale Rd
- 8301 Sandra St
- 5022 Laura Koppe Rd
- TBD Sandra St
- 8717 Peachtree St
- 8121 Shotwell St
- 4619 Laura Koppe Rd
- 10413 Peachtree St
- 4609 Laura Koppe Rd
- 6316 Laura Koppe Rd
- 4625 Laura Koppe Rd
- 7938 Pointer St
- 5123 E Crosstimbers St
- 8315 Lockwood Dr
- 4820 Jones Jones Dr
- 4820 Jones St
- 8215 Lockwood Dr
- 4901 Bostic St Unit 4901-17
- 4901 Bostic St
- 4901 Bostic St Unit 9
- 4814 Bostic St
- 4803 Bostic St
- 9711 Lockwood Dr
- 7313 Lockwood Dr
- 4812 Bostic St
- 4808 Jones St
- 4801 Bostic St
- 4810 Bostic St
- 4913 Bostic St
- 4907 Bostic St Unit B
- 4907 Bostic St Unit A
- 4907 Bostic St
- 8401 Lockwood Dr