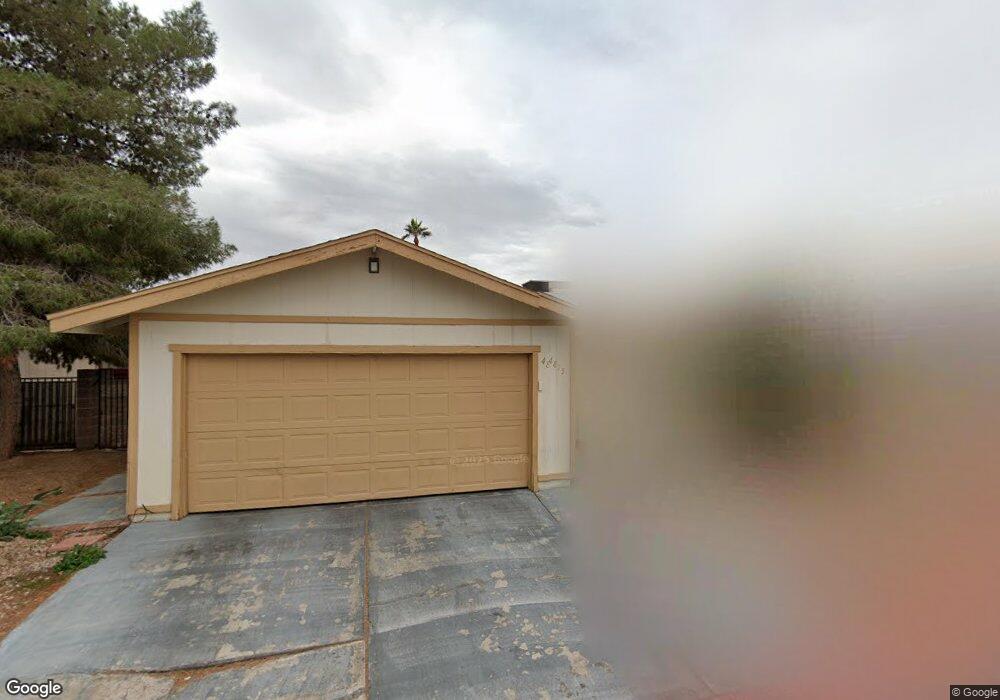
4815 Val Verde Ct Las Vegas, NV 89122
Estimated Value: $319,766 - $383,000
4
Beds
2
Baths
1,438
Sq Ft
$242/Sq Ft
Est. Value
About This Home
This home is located at 4815 Val Verde Ct, Las Vegas, NV 89122 and is currently estimated at $347,692, approximately $241 per square foot. 4815 Val Verde Ct is a home located in Clark County with nearby schools including Sister Robert Joseph Bailey Elementary School and Francis H Cortney Junior High School.
Ownership History
Date
Name
Owned For
Owner Type
Purchase Details
Closed on
Mar 6, 2007
Sold by
Logan Jerry
Bought by
Jerry Logan Living Trust
Current Estimated Value
Purchase Details
Closed on
Jun 26, 2003
Sold by
Va
Bought by
Logan Jerry
Home Financials for this Owner
Home Financials are based on the most recent Mortgage that was taken out on this home.
Original Mortgage
$78,400
Outstanding Balance
$33,231
Interest Rate
5.22%
Mortgage Type
Commercial
Estimated Equity
$314,461
Purchase Details
Closed on
Dec 16, 2002
Sold by
Ziemkowski Thomas J and Ziemkowski Jody A
Bought by
Va
Purchase Details
Closed on
Jun 21, 1994
Sold by
Vasquez Rosemarie T
Bought by
Ziemkowski Thomas J and Ziemkowski Jody A
Home Financials for this Owner
Home Financials are based on the most recent Mortgage that was taken out on this home.
Original Mortgage
$92,106
Interest Rate
8.83%
Mortgage Type
Commercial
Create a Home Valuation Report for This Property
The Home Valuation Report is an in-depth analysis detailing your home's value as well as a comparison with similar homes in the area
Home Values in the Area
Average Home Value in this Area
Purchase History
| Date | Buyer | Sale Price | Title Company |
|---|---|---|---|
| Jerry Logan Living Trust | -- | None Available | |
| Logan Jerry | $98,000 | Land Title Of Nevada | |
| Va | $88,130 | Stewart Title | |
| Ziemkowski Thomas J | $86,000 | Fidelity National Title |
Source: Public Records
Mortgage History
| Date | Status | Borrower | Loan Amount |
|---|---|---|---|
| Open | Logan Jerry | $78,400 | |
| Previous Owner | Ziemkowski Thomas J | $92,106 |
Source: Public Records
Tax History Compared to Growth
Tax History
| Year | Tax Paid | Tax Assessment Tax Assessment Total Assessment is a certain percentage of the fair market value that is determined by local assessors to be the total taxable value of land and additions on the property. | Land | Improvement |
|---|---|---|---|---|
| 2025 | $592 | $46,046 | $21,700 | $24,346 |
| 2024 | $576 | $46,046 | $21,700 | $24,346 |
| 2023 | $603 | $48,549 | $24,500 | $24,049 |
| 2022 | $586 | $42,052 | $19,600 | $22,452 |
| 2021 | $543 | $37,897 | $16,100 | $21,797 |
| 2020 | $524 | $37,823 | $15,750 | $22,073 |
| 2019 | $518 | $35,762 | $13,650 | $22,112 |
| 2018 | $494 | $31,271 | $9,800 | $21,471 |
| 2017 | $903 | $30,537 | $8,750 | $21,787 |
| 2016 | $469 | $24,706 | $5,250 | $19,456 |
| 2015 | $468 | $20,284 | $4,200 | $16,084 |
| 2014 | -- | $16,435 | $3,150 | $13,285 |
Source: Public Records
Map
Nearby Homes
- 4810 Palacio Ct
- 4789 Carefree Dr
- 4742 Tierra Verde St
- 4924 Conglobate St
- 6143 Basilone Ave
- 4911 Toad Lily St
- 4917 Toad Lily St
- 6174 Blood Lily Ave
- 4929 Toad Lily St
- Cypress Plan at Tropicana Gardens
- Juniper Plan at Tropicana Gardens
- Oak Plan at Tropicana Gardens
- 6180 Blood Lily Ave
- 4935 Toad Lily St
- 4941 Toad Lily St
- 6198 Blood Lily Ave
- 6210 Blood Lily Ave
- 6209 Lenaking Ave
- 6191 Blood Lily Ave
- 6216 Blood Lily Ave
- 4815 Val Verde Ct Unit n/a
- 4819 Val Verde Ct
- 4798 Tierra Verde St
- 4822 Palacio Ct
- 4810 Val Verde Ct
- 4837 Val Verde Ct
- 4799 Benecia Way
- 4822 Val Verde Ct
- 4836 Palacio Ct
- 4792 Tierra Verde St
- 4799 Tierra Verde St
- 4793 Benecia Way
- 4836 Val Verde Ct
- 4843 Val Verde Ct Unit 1
- 4793 Tierra Verde St
- 4842 Palacio Ct
- 4815 Palacio Ct
- 4782 Tierra Verde St
- 4819 Palacio Ct
- 4798 Benecia Way