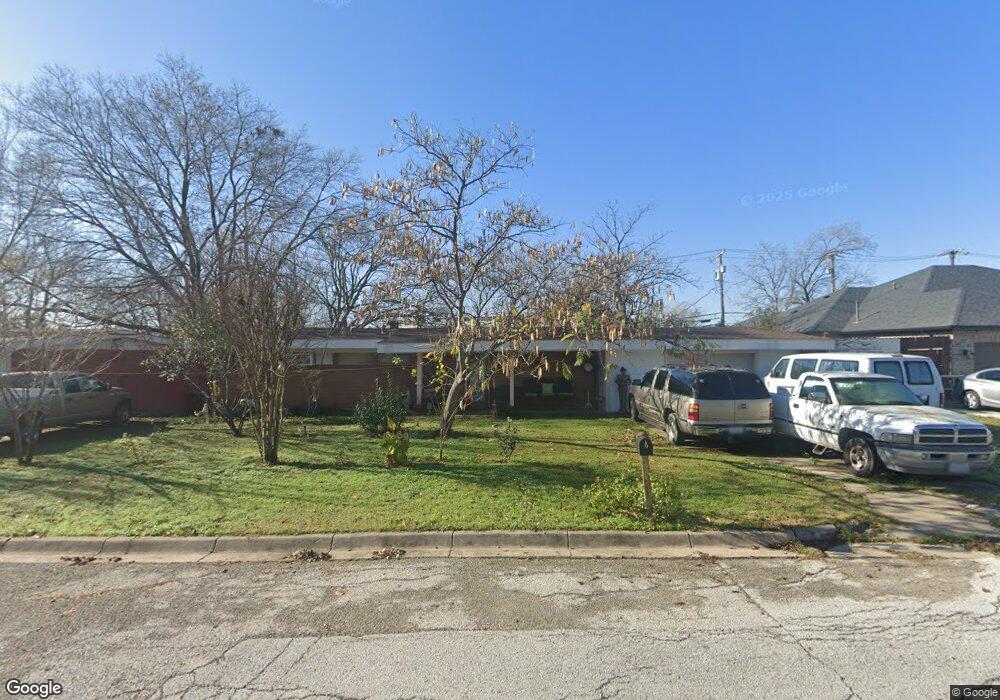
4817 Ash St North Richland Hills, TX 76180
Estimated Value: $236,000 - $279,000
3
Beds
2
Baths
1,231
Sq Ft
$204/Sq Ft
Est. Value
About This Home
This home is located at 4817 Ash St, North Richland Hills, TX 76180 and is currently estimated at $251,671, approximately $204 per square foot. 4817 Ash St is a home located in Tarrant County with nearby schools including Jack C Binion Elementary School, Richland Middle School, and Birdville High School.
Ownership History
Date
Name
Owned For
Owner Type
Purchase Details
Closed on
Jan 15, 2005
Sold by
Francis E & Melba J Griffin Revocable Li
Bought by
Mijango Jose and Mijango Amabilia
Current Estimated Value
Home Financials for this Owner
Home Financials are based on the most recent Mortgage that was taken out on this home.
Original Mortgage
$61,964
Interest Rate
5.82%
Mortgage Type
Seller Take Back
Purchase Details
Closed on
Apr 14, 2004
Sold by
Griffin Melba
Bought by
Mijango Jose and Mijango Amabilia
Purchase Details
Closed on
Jul 10, 2003
Sold by
Blakely Harold
Bought by
Francis E & Melba J Griffin Revocable Li
Purchase Details
Closed on
Oct 3, 2002
Sold by
Griffin Francis E and Griffin Melba J
Bought by
Blakely Harold
Home Financials for this Owner
Home Financials are based on the most recent Mortgage that was taken out on this home.
Original Mortgage
$67,000
Interest Rate
6.01%
Mortgage Type
Seller Take Back
Create a Home Valuation Report for This Property
The Home Valuation Report is an in-depth analysis detailing your home's value as well as a comparison with similar homes in the area
Home Values in the Area
Average Home Value in this Area
Purchase History
| Date | Buyer | Sale Price | Title Company |
|---|---|---|---|
| Mijango Jose | -- | -- | |
| Mijango Jose | $68,000 | -- | |
| Francis E & Melba J Griffin Revocable Li | $69,372 | -- | |
| Blakely Harold | -- | -- |
Source: Public Records
Mortgage History
| Date | Status | Borrower | Loan Amount |
|---|---|---|---|
| Closed | Mijango Jose | $61,964 | |
| Previous Owner | Blakely Harold | $67,000 |
Source: Public Records
Tax History Compared to Growth
Tax History
| Year | Tax Paid | Tax Assessment Tax Assessment Total Assessment is a certain percentage of the fair market value that is determined by local assessors to be the total taxable value of land and additions on the property. | Land | Improvement |
|---|---|---|---|---|
| 2025 | $2,114 | $210,156 | $55,000 | $155,156 |
| 2024 | $2,114 | $210,156 | $55,000 | $155,156 |
| 2023 | $3,312 | $211,541 | $55,000 | $156,541 |
| 2022 | $3,303 | $178,009 | $25,000 | $153,009 |
| 2021 | $3,175 | $149,585 | $25,000 | $124,585 |
| 2020 | $2,886 | $130,181 | $25,000 | $105,181 |
| 2019 | $2,715 | $103,117 | $25,000 | $78,117 |
| 2018 | $2,403 | $108,680 | $25,000 | $83,680 |
| 2017 | $3,243 | $120,535 | $25,000 | $95,535 |
| 2016 | $2,876 | $106,892 | $15,000 | $91,892 |
| 2015 | $1,725 | $64,200 | $12,000 | $52,200 |
| 2014 | $1,725 | $64,200 | $12,000 | $52,200 |
Source: Public Records
Map
Nearby Homes
- 7908 Lazy Lane Rd
- 8020 Laura St
- 5020 Colorado Blvd
- 5016 Wyoming Trail
- 5113 Bob Dr
- 4916 Susan Lee Ln
- 7800 Arnold Terrace
- 5024 Maryanna Way
- Dalton II Plan at City Point
- Zoe Plan at City Point
- Hampton Plan at City Point
- Conrad Plan at City Point
- 7717 Janetta Dr
- 4540 Ward St
- 4357 Union St
- 4352 Henderson Ave
- 4529 Ward St
- 5016 Winder Ct
- 5117 Maryanna Way
- Makena Plan at City Point
- 4813 Ash St
- 4821 Ash St
- 4809 Ash St
- 7901 Laura St
- 7900 Laura St
- 7800 Grapevine Hwy
- 4805 Ash St
- 7901 Lazy Lane Rd
- 7905 Laura St
- 7904 Laura St
- 7905 Lazy Lane Rd
- 7909 Laura St
- 7909 Lazy Lane Rd
- 7908 Laura St
- 7913 Lazy Lane Rd
- 7913 Laura St
- 7904 Lazy Lane Rd
- 7912 Laura St
- 7917 Lazy Lane Rd
- 7917 Laura St