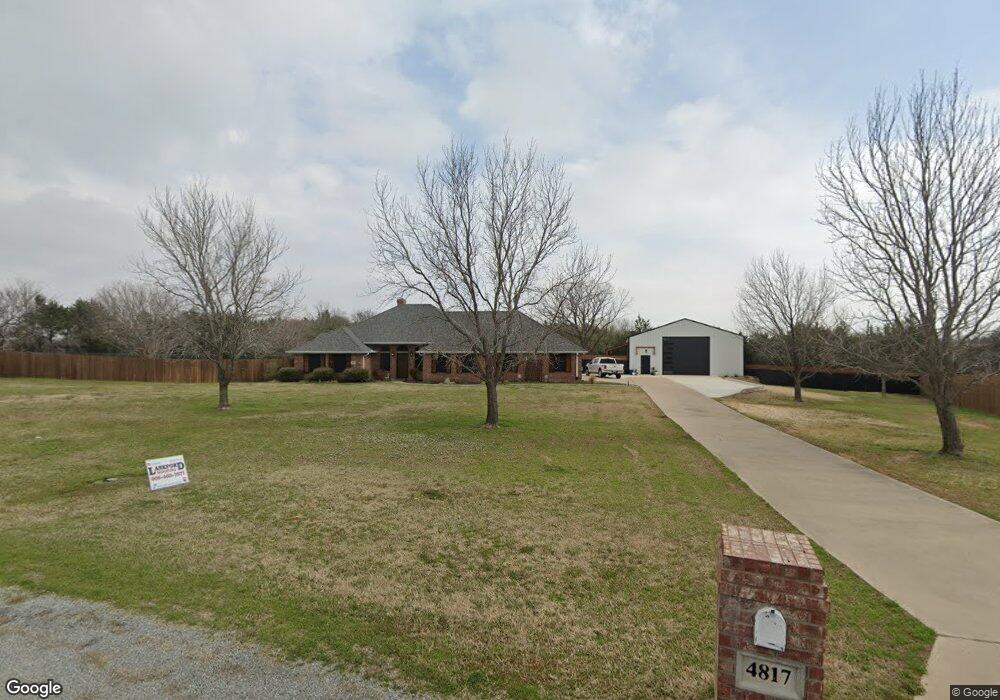
4817 Bello Vista Ct Sherman, TX 75090
Estimated Value: $470,000 - $583,674
4
Beds
2
Baths
2,552
Sq Ft
$207/Sq Ft
Est. Value
About This Home
This home is located at 4817 Bello Vista Ct, Sherman, TX 75090 and is currently estimated at $528,169, approximately $206 per square foot. 4817 Bello Vista Ct is a home located in Grayson County with nearby schools including Percy W. Neblett Elementary School, Dillingham Intermediate School, and Piner Middle School.
Ownership History
Date
Name
Owned For
Owner Type
Purchase Details
Closed on
Jul 2, 2019
Sold by
Knipling Samuel E and Knipling Sheila A
Bought by
Jambor Daniel B and Jackson Amy C
Current Estimated Value
Home Financials for this Owner
Home Financials are based on the most recent Mortgage that was taken out on this home.
Original Mortgage
$256,000
Outstanding Balance
$166,661
Interest Rate
3.5%
Mortgage Type
New Conventional
Estimated Equity
$361,508
Purchase Details
Closed on
Oct 22, 2009
Sold by
Harney Gina G
Bought by
Sweet Timothy Kane and Sweet Keri K
Purchase Details
Closed on
May 31, 2007
Sold by
Relocation Advantage Llc
Bought by
Knipling Samuel E and Knipling Sheila A
Home Financials for this Owner
Home Financials are based on the most recent Mortgage that was taken out on this home.
Original Mortgage
$181,200
Interest Rate
6.15%
Mortgage Type
Purchase Money Mortgage
Create a Home Valuation Report for This Property
The Home Valuation Report is an in-depth analysis detailing your home's value as well as a comparison with similar homes in the area
Home Values in the Area
Average Home Value in this Area
Purchase History
| Date | Buyer | Sale Price | Title Company |
|---|---|---|---|
| Jambor Daniel B | -- | Red River Title Co | |
| Sweet Timothy Kane | -- | None Available | |
| Knipling Samuel E | -- | Chapin Title Co Inc | |
| Relocation Advantage Llc | -- | Chapin Title Co Inc |
Source: Public Records
Mortgage History
| Date | Status | Borrower | Loan Amount |
|---|---|---|---|
| Open | Jambor Daniel B | $256,000 | |
| Previous Owner | Relocation Advantage Llc | $181,200 |
Source: Public Records
Tax History Compared to Growth
Tax History
| Year | Tax Paid | Tax Assessment Tax Assessment Total Assessment is a certain percentage of the fair market value that is determined by local assessors to be the total taxable value of land and additions on the property. | Land | Improvement |
|---|---|---|---|---|
| 2025 | $10,457 | $605,020 | -- | -- |
| 2024 | $12,063 | $550,018 | $0 | $0 |
| 2023 | $9,389 | $500,016 | $0 | $0 |
| 2022 | $8,790 | $375,055 | $0 | $0 |
| 2021 | $8,546 | $340,959 | $61,200 | $279,759 |
| 2020 | $8,444 | $321,731 | $61,200 | $260,531 |
| 2019 | $8,970 | $332,789 | $46,000 | $286,789 |
| 2018 | $8,070 | $321,643 | $46,000 | $275,643 |
| 2017 | $7,398 | $297,200 | $46,000 | $251,200 |
| 2016 | $6,808 | $288,502 | $46,000 | $242,502 |
| 2015 | $4,497 | $248,629 | $46,000 | $202,629 |
| 2014 | $4,641 | $244,747 | $40,000 | $204,747 |
Source: Public Records
Map
Nearby Homes
- 5585 S Fannin Ave
- 4517 Playa Ct
- 4604 Bello Vista Cir
- 4605 Dripping Spring Rd
- TBD 1 Dripping Spring Rd
- 257 Russell Ln
- 918 Cleve Cole
- 327 Russell Ln
- 492 Russell Ln
- 461 Cleve Cole Rd
- 486 Cleve Cole Rd
- 30 Tananger Springs Dr
- 811 Russell Ln
- 376 Tananger Springs Dr
- 2025 Woodlake Rd
- 9426 Dripping Spring Rd
- 9436 Dripping Spring Rd
- 9408 Dripping Spring Rd
- 9386 Dripping Spring Rd
- TBD Cleve Cole Rd
- 4915 Bello Vista Ct
- 4811 Bello Vista Ct
- 4810 Bello Vista Ct
- 4909 Bello Vista Ct
- 4809 Bello Vista Ct
- 4806 Bello Vista Ct
- 5101 Bello Vista Ct
- 5205 Bello Vista Ct
- 4805 Bello Vista Ct
- 94 Melody Cir
- 5213 Bello Vista Dr
- 74 Melody Cir
- 5301 Bello Vista Dr
- 5110 Bello Vista Ct
- 5202 Bello Vista Ct
- 5305 Bello Vista Dr
- 5687 S Fannin Ave
- 107 Melody Cir
- 5300 Bello Vista Dr
- 5309 Bello Vista Dr