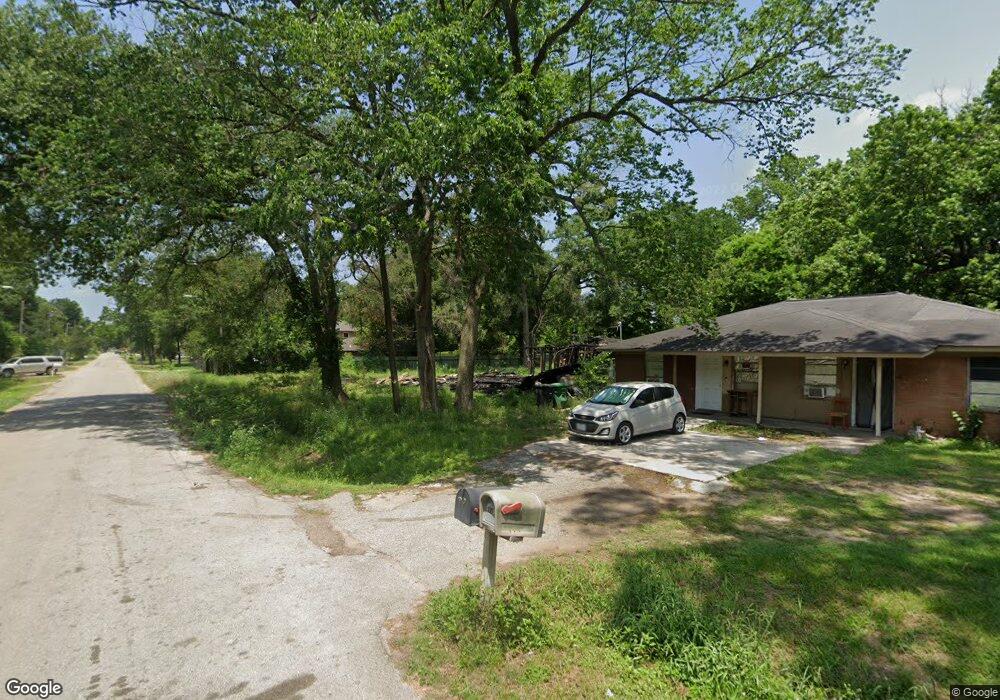
4817 Boicewood St Unit 4817 Houston, TX 77016
Trinity-Houston Gardens NeighborhoodEstimated Value: $278,237 - $371,000
12
Beds
6
Baths
1,485
Sq Ft
$226/Sq Ft
Est. Value
About This Home
This home is located at 4817 Boicewood St Unit 4817, Houston, TX 77016 and is currently estimated at $335,809, approximately $226 per square foot. 4817 Boicewood St Unit 4817 is a home located in Harris County with nearby schools including Felix Cook Jr. Elementary School, Key Middle, and Kashmere High School.
Ownership History
Date
Name
Owned For
Owner Type
Purchase Details
Closed on
Oct 23, 2015
Sold by
Otero Christian
Bought by
Bonilla Arnold
Current Estimated Value
Home Financials for this Owner
Home Financials are based on the most recent Mortgage that was taken out on this home.
Original Mortgage
$179,000
Outstanding Balance
$141,217
Interest Rate
3.96%
Estimated Equity
$194,592
Purchase Details
Closed on
Nov 19, 2013
Sold by
Marquez Gloria
Bought by
Otero Christian
Home Financials for this Owner
Home Financials are based on the most recent Mortgage that was taken out on this home.
Original Mortgage
$179,000
Interest Rate
4.29%
Purchase Details
Closed on
Dec 1, 2008
Sold by
Sullivan Michael
Bought by
Marquez Gloria
Home Financials for this Owner
Home Financials are based on the most recent Mortgage that was taken out on this home.
Original Mortgage
$179,000
Interest Rate
4%
Mortgage Type
Seller Take Back
Purchase Details
Closed on
Oct 23, 2008
Sold by
Ornelas Juan C and Ornelas Sandra E
Bought by
Grinton Kim
Home Financials for this Owner
Home Financials are based on the most recent Mortgage that was taken out on this home.
Original Mortgage
$179,000
Interest Rate
4%
Mortgage Type
Seller Take Back
Purchase Details
Closed on
Jul 20, 2006
Sold by
Grinton Kim
Bought by
Sullivan Michael
Purchase Details
Closed on
Dec 2, 2005
Sold by
Sullivan Patrick
Bought by
Grinton Kim
Purchase Details
Closed on
Sep 17, 2005
Sold by
Grinton Kim
Bought by
Ornelas Juan C and Ornelas Sandra E
Home Financials for this Owner
Home Financials are based on the most recent Mortgage that was taken out on this home.
Original Mortgage
$171,500
Interest Rate
6.15%
Mortgage Type
Seller Take Back
Purchase Details
Closed on
Oct 24, 1996
Sold by
Lindahl Donald A and Stencel Veronica
Bought by
Long Michael E and Long Deborah A
Home Financials for this Owner
Home Financials are based on the most recent Mortgage that was taken out on this home.
Original Mortgage
$25,000
Interest Rate
10%
Purchase Details
Closed on
Aug 1, 1996
Sold by
Dlf Inc
Bought by
Lindahl Donald A and Stencel Veronica
Purchase Details
Closed on
Jul 12, 1995
Sold by
Sullivan Patrick H and Sullivan Barbara M
Bought by
Dlf Inc
Home Financials for this Owner
Home Financials are based on the most recent Mortgage that was taken out on this home.
Original Mortgage
$88,000
Interest Rate
11.03%
Purchase Details
Closed on
Mar 24, 1995
Sold by
Sullivan Michael P
Bought by
Sullivan Patrick H and Sullivan Barbara
Create a Home Valuation Report for This Property
The Home Valuation Report is an in-depth analysis detailing your home's value as well as a comparison with similar homes in the area
Home Values in the Area
Average Home Value in this Area
Purchase History
| Date | Buyer | Sale Price | Title Company |
|---|---|---|---|
| Bonilla Arnold | -- | None Available | |
| Otero Christian | -- | None Available | |
| Marquez Gloria | -- | None Available | |
| Marquez Gloria | -- | None Available | |
| Grinton Kim | -- | None Available | |
| Sullivan Michael | -- | None Available | |
| Grinton Kim | -- | -- | |
| Ornelas Juan C | -- | None Available | |
| Long Michael E | $25,000 | -- | |
| Lindahl Donald A | -- | -- | |
| Dlf Inc | $93,000 | -- | |
| Sullivan Patrick H | -- | -- | |
| Sullivan Patrick H | -- | -- |
Source: Public Records
Mortgage History
| Date | Status | Borrower | Loan Amount |
|---|---|---|---|
| Open | Bonilla Arnold | $179,000 | |
| Previous Owner | Otero Christian | $179,000 | |
| Previous Owner | Marquez Gloria | $179,000 | |
| Previous Owner | Marquez Gloria | $17,900 | |
| Previous Owner | Ornelas Juan C | $171,500 | |
| Previous Owner | Long Michael E | $25,000 | |
| Previous Owner | Dlf Inc | $88,000 |
Source: Public Records
Tax History Compared to Growth
Tax History
| Year | Tax Paid | Tax Assessment Tax Assessment Total Assessment is a certain percentage of the fair market value that is determined by local assessors to be the total taxable value of land and additions on the property. | Land | Improvement |
|---|---|---|---|---|
| 2025 | $2,870 | $316,428 | $67,215 | $249,213 |
| 2024 | $2,870 | $314,900 | $67,215 | $247,685 |
| 2023 | $2,870 | $307,611 | $67,215 | $240,396 |
| 2022 | $4,057 | $216,598 | $44,810 | $171,788 |
| 2021 | $3,904 | $207,231 | $29,127 | $178,104 |
| 2020 | $3,687 | $193,502 | $20,165 | $173,337 |
| 2019 | $3,503 | $161,861 | $14,339 | $147,522 |
| 2018 | $2,258 | $129,230 | $14,339 | $114,891 |
| 2017 | $2,893 | $129,230 | $14,339 | $114,891 |
| 2016 | $3,156 | $124,807 | $11,203 | $113,604 |
| 2015 | $2,402 | $93,424 | $8,962 | $84,462 |
| 2014 | $2,402 | $93,424 | $8,962 | $84,462 |
Source: Public Records
Map
Nearby Homes
- 5017 Boicewood St
- 4915 Fitch St
- 4814 Firnat St
- 5105 Earline St
- 5109 Earline St
- 5022 Laura Koppe Rd
- 4625 Laura Koppe Rd
- 4622 Firnat St
- 4924 Tronewood St
- 4619 Laura Koppe Rd
- 10413 Peachtree St
- 4609 Laura Koppe Rd
- 6316 Laura Koppe Rd
- 4917 Tronewood St
- 7212 Lockwood Dr
- 8617 Clarington St
- 4506 Boicewood St
- 8717 Peachtree St
- 8613 Lavender St
- 7310 Lockwood Dr
- 4817 Boicewood St
- 4817 Boicewood St Unit 3
- 9007 Lockwood Dr
- 9009 Lockwood Dr
- 4818 Boicewood St
- 4813 Boicewood St
- 8917 Lockwood Dr
- 4816 Boicewood St
- 9015 Lockwood Dr
- 8913 Lockwood Dr
- 4814 Fitch St
- 8909 Lockwood Dr
- 8918 Lockwood Dr
- 9017 Lockwood Dr
- 4805 Boicewood St
- 4810 Fitch St
- 4804 Boicewood St
- 4914 Boicewood St
- 8907 Lockwood Dr
- 4804 Fitch St