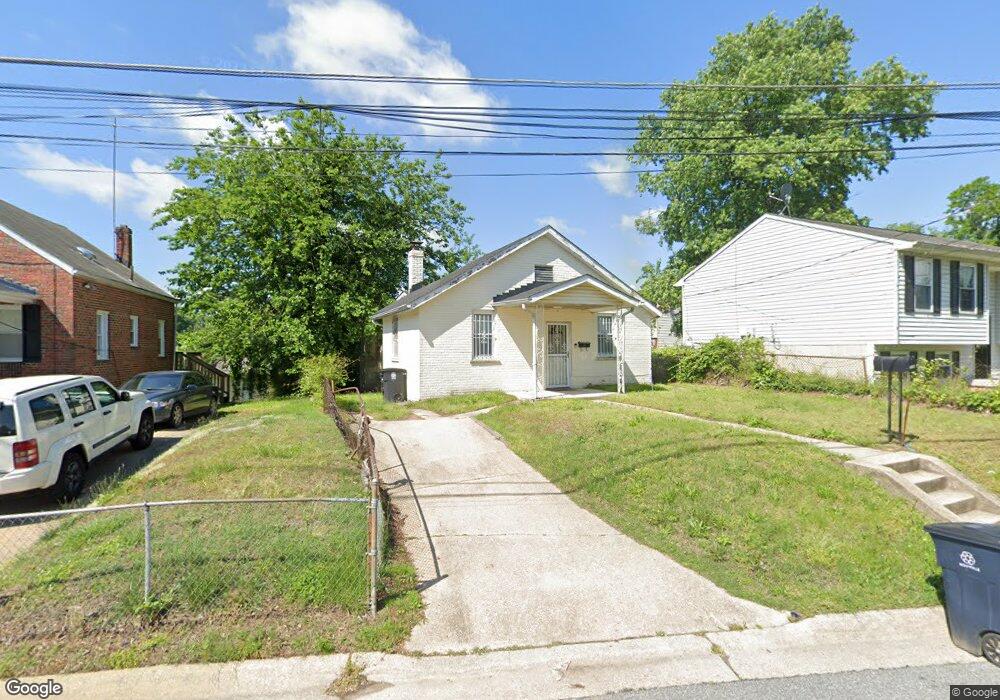
4817 Emo St Capitol Heights, MD 20743
Estimated Value: $267,000 - $339,000
3
Beds
1
Bath
1,050
Sq Ft
$287/Sq Ft
Est. Value
About This Home
This home is located at 4817 Emo St, Capitol Heights, MD 20743 and is currently estimated at $300,977, approximately $286 per square foot. 4817 Emo St is a home located in Prince George's County with nearby schools including William W. Hall Academy, Suitland High School, and DC Scholars Public Charter School.
Ownership History
Date
Name
Owned For
Owner Type
Purchase Details
Closed on
Oct 17, 2008
Sold by
Carroll Stacy M
Bought by
Byrd Shaheena
Current Estimated Value
Home Financials for this Owner
Home Financials are based on the most recent Mortgage that was taken out on this home.
Original Mortgage
$176,234
Outstanding Balance
$117,192
Interest Rate
6.43%
Mortgage Type
FHA
Estimated Equity
$183,785
Purchase Details
Closed on
Sep 26, 2008
Sold by
Carroll Stacy M
Bought by
Byrd Shaheena
Home Financials for this Owner
Home Financials are based on the most recent Mortgage that was taken out on this home.
Original Mortgage
$176,234
Outstanding Balance
$117,192
Interest Rate
6.43%
Mortgage Type
FHA
Estimated Equity
$183,785
Purchase Details
Closed on
Nov 4, 1971
Sold by
Yadin Mort and Yadin Motl
Bought by
Jones Lena and Jones Benjamin F
Create a Home Valuation Report for This Property
The Home Valuation Report is an in-depth analysis detailing your home's value as well as a comparison with similar homes in the area
Home Values in the Area
Average Home Value in this Area
Purchase History
| Date | Buyer | Sale Price | Title Company |
|---|---|---|---|
| Byrd Shaheena | $179,000 | -- | |
| Byrd Shaheena | $179,000 | -- | |
| Jones Lena | $16,000 | -- |
Source: Public Records
Mortgage History
| Date | Status | Borrower | Loan Amount |
|---|---|---|---|
| Open | Byrd Shaheena | $176,234 | |
| Closed | Byrd Shaheena | $176,234 |
Source: Public Records
Tax History Compared to Growth
Tax History
| Year | Tax Paid | Tax Assessment Tax Assessment Total Assessment is a certain percentage of the fair market value that is determined by local assessors to be the total taxable value of land and additions on the property. | Land | Improvement |
|---|---|---|---|---|
| 2025 | $2,882 | $232,800 | -- | -- |
| 2024 | $2,882 | $211,800 | $0 | $0 |
| 2023 | $2,745 | $190,800 | $60,100 | $130,700 |
| 2022 | $2,030 | $182,533 | $0 | $0 |
| 2021 | $2,484 | $174,267 | $0 | $0 |
| 2020 | $4,959 | $166,000 | $45,000 | $121,000 |
| 2019 | $2,265 | $158,200 | $0 | $0 |
| 2018 | $2,312 | $150,400 | $0 | $0 |
| 2017 | $2,225 | $142,600 | $0 | $0 |
| 2016 | -- | $133,567 | $0 | $0 |
| 2015 | $3,424 | $124,533 | $0 | $0 |
| 2014 | $3,424 | $115,500 | $0 | $0 |
Source: Public Records
Map
Nearby Homes