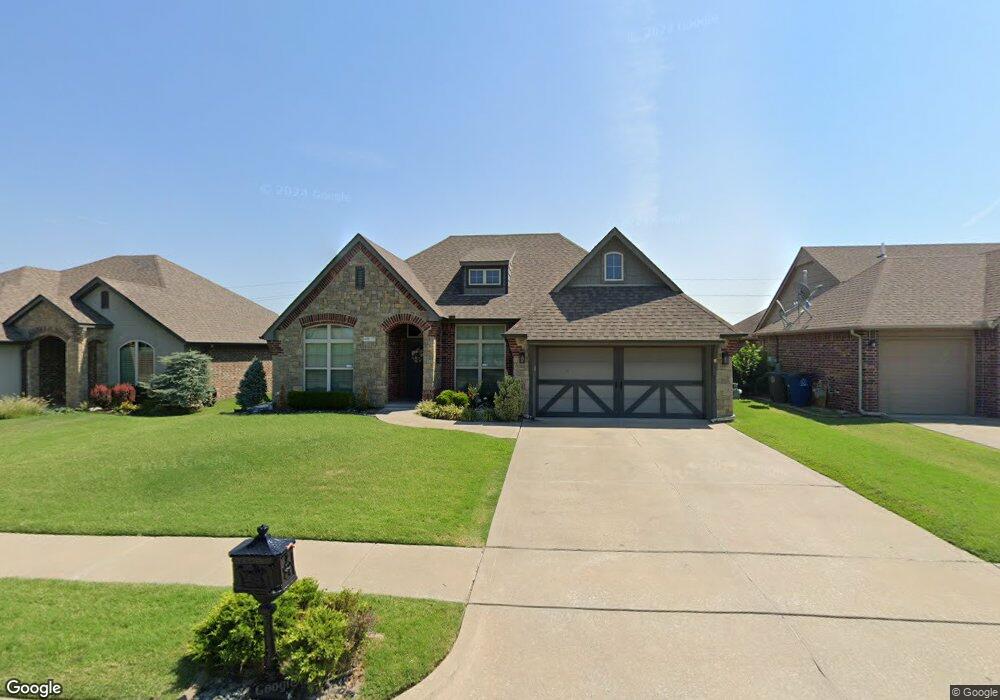
4817 S 185th East Ave Tulsa, OK 74134
Stone Creek Farms NeighborhoodEstimated Value: $312,000 - $326,000
3
Beds
2
Baths
1,960
Sq Ft
$162/Sq Ft
Est. Value
About This Home
This home is located at 4817 S 185th East Ave, Tulsa, OK 74134 and is currently estimated at $317,819, approximately $162 per square foot. 4817 S 185th East Ave is a home with nearby schools including Country Lane Primary Elementary School, Country Lane Intermediate School, and Centennial Middle School.
Ownership History
Date
Name
Owned For
Owner Type
Purchase Details
Closed on
Mar 17, 2025
Sold by
Moreno Adriana and Moreno Ivan
Bought by
Layne Brenda and Layne Michael
Current Estimated Value
Home Financials for this Owner
Home Financials are based on the most recent Mortgage that was taken out on this home.
Original Mortgage
$270,000
Outstanding Balance
$268,147
Interest Rate
6.87%
Mortgage Type
VA
Estimated Equity
$49,672
Purchase Details
Closed on
Jun 24, 2013
Sold by
Perry Hood Properties Inc
Bought by
Moreno Adriana and Moreno Ivan
Home Financials for this Owner
Home Financials are based on the most recent Mortgage that was taken out on this home.
Original Mortgage
$181,850
Interest Rate
3.43%
Mortgage Type
New Conventional
Purchase Details
Closed on
Apr 9, 2013
Sold by
Lynn Lane 51 Llc
Bought by
Perry Hood Properties Inc
Home Financials for this Owner
Home Financials are based on the most recent Mortgage that was taken out on this home.
Original Mortgage
$149,600
Interest Rate
3.58%
Mortgage Type
Construction
Create a Home Valuation Report for This Property
The Home Valuation Report is an in-depth analysis detailing your home's value as well as a comparison with similar homes in the area
Home Values in the Area
Average Home Value in this Area
Purchase History
| Date | Buyer | Sale Price | Title Company |
|---|---|---|---|
| Layne Brenda | $319,000 | First American Title Insurance | |
| Moreno Adriana | $187,500 | Scott Title & Escrow Co Inc | |
| Perry Hood Properties Inc | $34,000 | Charter Title |
Source: Public Records
Mortgage History
| Date | Status | Borrower | Loan Amount |
|---|---|---|---|
| Open | Layne Brenda | $270,000 | |
| Previous Owner | Moreno Adriana | $181,850 | |
| Previous Owner | Perry Hood Properties Inc | $149,600 |
Source: Public Records
Tax History Compared to Growth
Tax History
| Year | Tax Paid | Tax Assessment Tax Assessment Total Assessment is a certain percentage of the fair market value that is determined by local assessors to be the total taxable value of land and additions on the property. | Land | Improvement |
|---|---|---|---|---|
| 2025 | $3,806 | $28,381 | $3,370 | $25,011 |
| 2024 | $3,277 | $27,029 | $3,457 | $23,572 |
| 2023 | $3,277 | $25,742 | $3,215 | $22,527 |
| 2022 | $3,254 | $24,517 | $4,043 | $20,474 |
| 2021 | $3,130 | $23,349 | $3,850 | $19,499 |
| 2020 | $3,071 | $23,000 | $3,850 | $19,150 |
| 2019 | $3,185 | $23,000 | $3,850 | $19,150 |
| 2018 | $3,110 | $22,739 | $3,806 | $18,933 |
| 2017 | $2,955 | $21,656 | $3,625 | $18,031 |
| 2016 | $2,784 | $20,625 | $3,850 | $16,775 |
| 2015 | $2,790 | $20,625 | $3,850 | $16,775 |
| 2014 | $2,791 | $20,625 | $3,850 | $16,775 |
Source: Public Records
Map
Nearby Homes
- 4906 S 186th East Ave
- 18510 E 46th Place S
- 18204 E 48th Place
- 18402 E 46th St
- 18209 E 46th St
- 18717 E 50th Place S
- 4629 S 179th East Ave
- 4917 S 190th East Ave
- 18609 E 45th St S
- 17910 E 45th Place S
- 4723 S 177th East Place
- 18512 E 43rd Place S
- Dorsey IV Plan at Huntington Park II
- Walker ll Plan at Huntington Park II
- Hampton IV 3C Plan at Huntington Park II
- Ashville AE Plan at Huntington Park II
- Ashville Plan at Huntington Park II
- Brenda MG Plan at Huntington Park II
- Hampton III Plan at Huntington Park II
- Dorsey V Plan at Huntington Park II
- 4821 S 185th East Ave
- 4813 S 185th East Ave
- 4825 S 185th East Ave
- 4809 S 185th East Ave
- 4814 S 185th East Ave
- 4826 S 186th East Ave
- 4830 S 186th East Ave
- 4805 S 185th East Ave
- 4829 S 185th East Ave
- 18418 E 48th St
- 18413 E 48th Place
- 4726 S 186th East Ave
- 4834 S 186th East Ave
- 18601 E 48th Place
- 18414 E 48th St
- 4801 S 185th East Ave
- 18409 E 48th Place
- 18412 E 48th Place
- 18416 E 48th Place
- 4720 S 186th East Ave