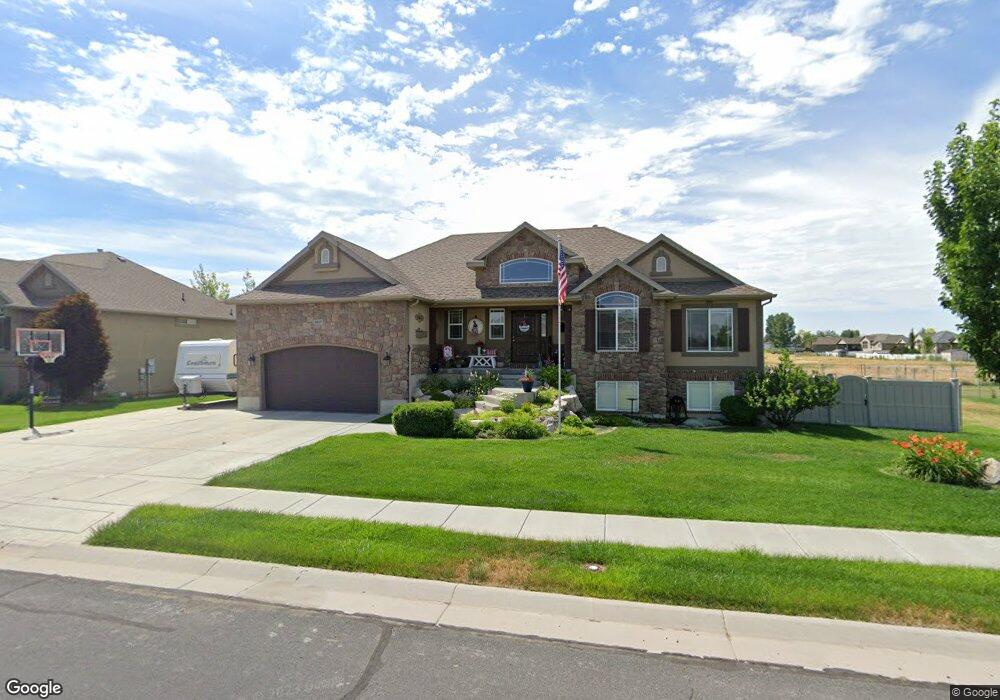
4817 W 4825 S Hooper, UT 84315
Estimated Value: $632,637 - $646,000
3
Beds
3
Baths
2,582
Sq Ft
$247/Sq Ft
Est. Value
About This Home
This home is located at 4817 W 4825 S, Hooper, UT 84315 and is currently estimated at $638,659, approximately $247 per square foot. 4817 W 4825 S is a home located in Weber County with nearby schools including Country View School, Rocky Mountain Junior High School, and Quest Academy.
Ownership History
Date
Name
Owned For
Owner Type
Purchase Details
Closed on
Dec 9, 2005
Sold by
Nilson & Co Inc
Bought by
Bernard Reed D and Bernard Shanna
Current Estimated Value
Home Financials for this Owner
Home Financials are based on the most recent Mortgage that was taken out on this home.
Original Mortgage
$228,350
Outstanding Balance
$126,622
Interest Rate
6.14%
Mortgage Type
Purchase Money Mortgage
Estimated Equity
$512,037
Purchase Details
Closed on
Nov 18, 2005
Sold by
Haws Development Corp
Bought by
Nilson & Co Inc and Nilson Homes
Home Financials for this Owner
Home Financials are based on the most recent Mortgage that was taken out on this home.
Original Mortgage
$228,350
Outstanding Balance
$126,622
Interest Rate
6.14%
Mortgage Type
Purchase Money Mortgage
Estimated Equity
$512,037
Create a Home Valuation Report for This Property
The Home Valuation Report is an in-depth analysis detailing your home's value as well as a comparison with similar homes in the area
Home Values in the Area
Average Home Value in this Area
Purchase History
| Date | Buyer | Sale Price | Title Company |
|---|---|---|---|
| Bernard Reed D | -- | Bonneville Title Company Sal | |
| Nilson & Co Inc | -- | Mountain View Title Ogden |
Source: Public Records
Mortgage History
| Date | Status | Borrower | Loan Amount |
|---|---|---|---|
| Open | Bernard Reed D | $228,350 | |
| Closed | Nilson & Co Inc | $53,692 |
Source: Public Records
Tax History
| Year | Tax Paid | Tax Assessment Tax Assessment Total Assessment is a certain percentage of the fair market value that is determined by local assessors to be the total taxable value of land and additions on the property. | Land | Improvement |
|---|---|---|---|---|
| 2025 | $3,446 | $623,863 | $216,580 | $407,283 |
| 2024 | $3,446 | $336,600 | $119,119 | $217,481 |
| 2023 | $1,114 | $347,600 | $119,462 | $228,138 |
| 2022 | $1,894 | $329,450 | $97,761 | $231,689 |
| 2021 | $1,483 | $498,000 | $112,836 | $385,164 |
| 2020 | $1,184 | $428,000 | $93,069 | $334,931 |
| 2019 | $993 | $386,000 | $93,289 | $292,711 |
| 2018 | $885 | $359,000 | $73,478 | $285,522 |
| 2017 | $724 | $329,000 | $72,446 | $256,554 |
| 2016 | $563 | $167,307 | $35,064 | $132,243 |
| 2015 | $513 | $162,611 | $36,665 | $125,946 |
| 2014 | $215 | $139,025 | $28,546 | $110,479 |
Source: Public Records
Map
Nearby Homes
- 4931 S 4700 W
- 4836 S 5050 W
- 4879 S 5050 W
- 4853 S 4275 W Unit 27
- 4486 S 4300 W
- 4277 W 5250 S
- 4367 W 5300 S
- 4218 W 5050 S
- 4700 W 5500 S
- 4216 W 5250 S
- 4126 S 4950 W
- 4088 W 5050 S
- 4695 W 4100 S
- 4101 W 4600 S
- 4309 W 5430 St #B S
- 4024 W 4650 S
- 3729 S 5600 W Unit 6
- 3720 S 5600 W Unit 2
- 3732 S 5600 W Unit 3
- 3719 S 5600 W Unit 7
Your Personal Tour Guide
Ask me questions while you tour the home.