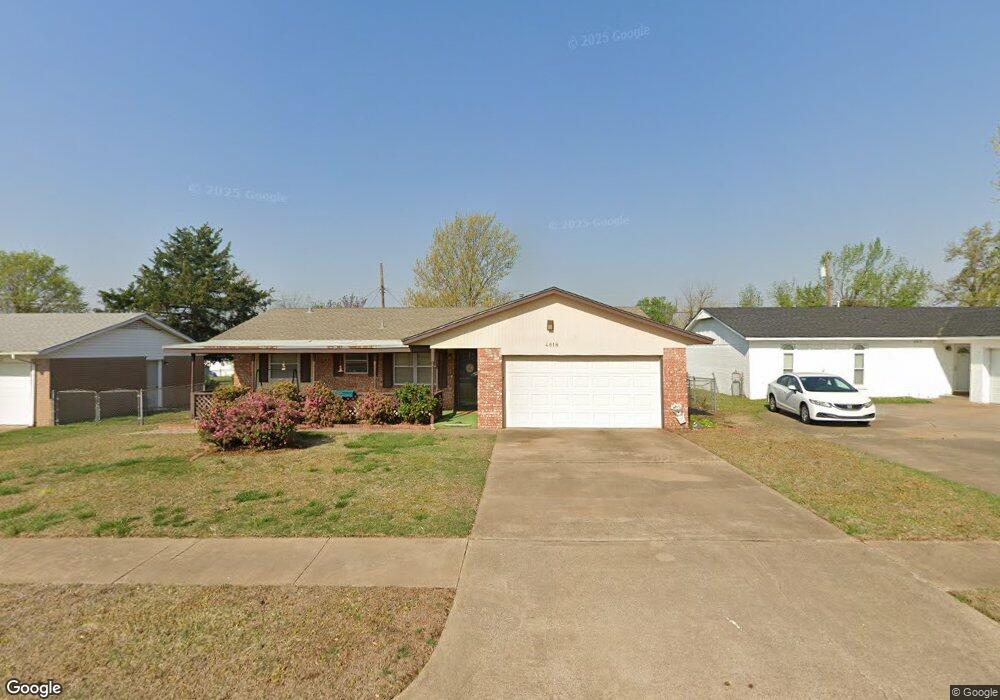
4818 Grenada Ave Sand Springs, OK 74063
Prattville NeighborhoodEstimated Value: $162,304 - $183,000
--
Bed
1
Bath
1,130
Sq Ft
$150/Sq Ft
Est. Value
About This Home
This home is located at 4818 Grenada Ave, Sand Springs, OK 74063 and is currently estimated at $169,326, approximately $149 per square foot. 4818 Grenada Ave is a home located in Tulsa County with nearby schools including Limestone Technology Academy, Clyde Boyd Middle School, and Charles Page High School.
Ownership History
Date
Name
Owned For
Owner Type
Purchase Details
Closed on
May 20, 2005
Sold by
Zicker Timothy R and Zicker Michelle Leigh
Bought by
Smith Jewel J
Current Estimated Value
Home Financials for this Owner
Home Financials are based on the most recent Mortgage that was taken out on this home.
Original Mortgage
$82,091
Outstanding Balance
$43,023
Interest Rate
5.92%
Mortgage Type
Fannie Mae Freddie Mac
Estimated Equity
$126,303
Purchase Details
Closed on
Jun 1, 1997
Home Financials for this Owner
Home Financials are based on the most recent Mortgage that was taken out on this home.
Original Mortgage
$61,098
Interest Rate
7.98%
Mortgage Type
VA
Purchase Details
Closed on
May 19, 1997
Sold by
Knighten Jean and Duncan Bervell Earl
Bought by
Zicker Timothy R and Zicker Michelle Leigh
Home Financials for this Owner
Home Financials are based on the most recent Mortgage that was taken out on this home.
Original Mortgage
$61,098
Interest Rate
7.98%
Mortgage Type
VA
Create a Home Valuation Report for This Property
The Home Valuation Report is an in-depth analysis detailing your home's value as well as a comparison with similar homes in the area
Home Values in the Area
Average Home Value in this Area
Purchase History
| Date | Buyer | Sale Price | Title Company |
|---|---|---|---|
| Smith Jewel J | $80,000 | First American Title & Abstr | |
| -- | $60,000 | -- | |
| Zicker Timothy R | $59,900 | -- |
Source: Public Records
Mortgage History
| Date | Status | Borrower | Loan Amount |
|---|---|---|---|
| Open | Smith Jewel J | $82,091 | |
| Previous Owner | Zicker Timothy R | $61,098 |
Source: Public Records
Tax History Compared to Growth
Tax History
| Year | Tax Paid | Tax Assessment Tax Assessment Total Assessment is a certain percentage of the fair market value that is determined by local assessors to be the total taxable value of land and additions on the property. | Land | Improvement |
|---|---|---|---|---|
| 2024 | $1,200 | $9,823 | $1,663 | $8,160 |
| 2023 | $1,200 | $10,508 | $1,779 | $8,729 |
| 2022 | $1,135 | $9,202 | $1,558 | $7,644 |
| 2021 | $1,117 | $8,904 | $1,934 | $6,970 |
| 2020 | $1,119 | $8,616 | $1,872 | $6,744 |
| 2019 | $1,052 | $8,336 | $1,811 | $6,525 |
| 2018 | $991 | $8,064 | $1,752 | $6,312 |
| 2017 | $940 | $8,800 | $2,090 | $6,710 |
| 2016 | $959 | $8,800 | $2,090 | $6,710 |
| 2015 | $973 | $8,800 | $2,090 | $6,710 |
| 2014 | $982 | $8,800 | $2,090 | $6,710 |
Source: Public Records
Map
Nearby Homes
- 409 Trinidad Dr
- 4822 Bermuda Cir
- 604 W 46th Place
- 321 W 50th Place
- 5109 S Nassau Ave
- 5117 S Nassau Ave
- 4204 Magnolia Dr
- 210 W 46th St
- 5310 S Andros Ave
- 5314 Bahama Ave
- 5114 S Everett St
- 5109 S Everett St
- 5110 S Everett St
- 5113 S Walnut Creek Dr
- 4247 Greentree Way Unit 33A
- 738 W 54th St
- 5114 S Everett Dr
- 5109 S Everett Dr
- 5110 S Everett Dr
- Ashville AE Plan at Stone Creek Estates IV
- 4814 Grenada Ave
- 4822 Grenada Ave
- 4817 Bahama Dr
- 4810 Grenada Ave
- 4826 Grenada Ave
- 4815 Bahama Dr
- 4821 Bahama Dr
- 4819 Grenada Ave
- 4815 Bahama Ave
- 4809 Bahama Dr
- 4813 Grenada Ave
- 4827 Bahama Dr
- 4823 Grenada Ave
- 4806 Grenada Ave
- 4827 Bahama Ave
- 4830 Grenada Ave
- 4811 Grenada Ave
- 4827 Grenada Ave
- 4807 Bahama Dr
- 4829 Bahama Dr