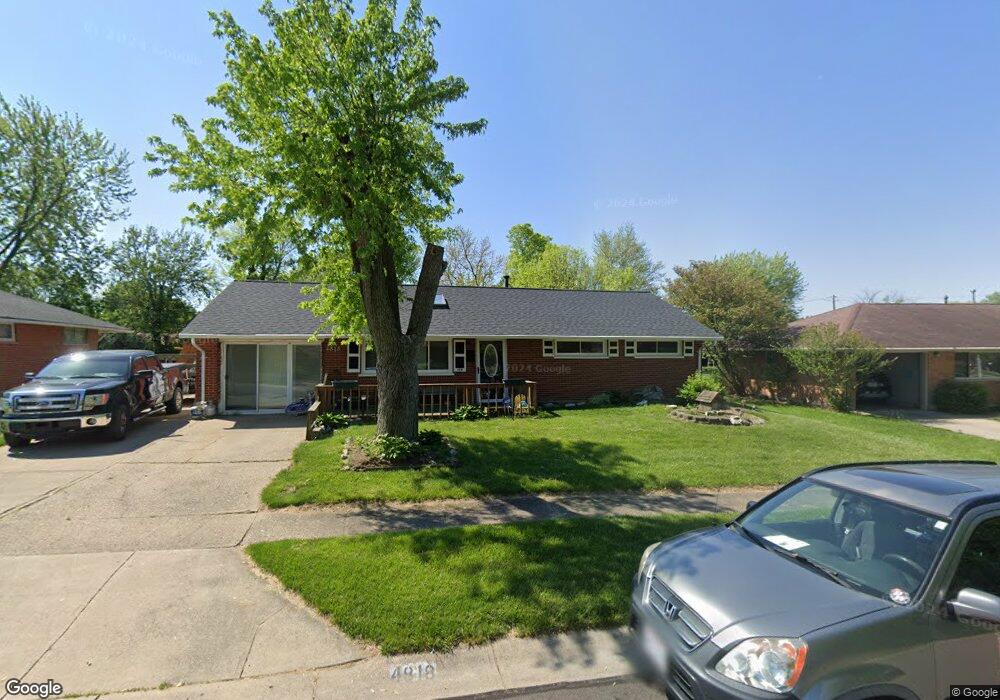
4818 Nelapark Dr Dayton, OH 45424
Estimated Value: $168,000 - $198,704
3
Beds
2
Baths
1,080
Sq Ft
$170/Sq Ft
Est. Value
About This Home
This home is located at 4818 Nelapark Dr, Dayton, OH 45424 and is currently estimated at $183,676, approximately $170 per square foot. 4818 Nelapark Dr is a home located in Montgomery County with nearby schools including Wayne High School and Huber Heights Christian Academy.
Ownership History
Date
Name
Owned For
Owner Type
Purchase Details
Closed on
May 25, 2022
Sold by
Williams Larry D and Williams Blondie
Bought by
Williams Revocable Trust and Williams
Current Estimated Value
Purchase Details
Closed on
Jun 17, 2003
Sold by
David Goins and David Judy M
Bought by
Williams Larry D and Williams Blondie
Home Financials for this Owner
Home Financials are based on the most recent Mortgage that was taken out on this home.
Original Mortgage
$87,900
Interest Rate
5.71%
Mortgage Type
VA
Purchase Details
Closed on
Apr 3, 2001
Sold by
Ball Betty D
Bought by
Goins David
Home Financials for this Owner
Home Financials are based on the most recent Mortgage that was taken out on this home.
Original Mortgage
$69,255
Interest Rate
7.02%
Purchase Details
Closed on
Apr 8, 1999
Sold by
Thomas Bocko
Bought by
Ball Betty D
Home Financials for this Owner
Home Financials are based on the most recent Mortgage that was taken out on this home.
Original Mortgage
$37,000
Interest Rate
6.94%
Create a Home Valuation Report for This Property
The Home Valuation Report is an in-depth analysis detailing your home's value as well as a comparison with similar homes in the area
Home Values in the Area
Average Home Value in this Area
Purchase History
| Date | Buyer | Sale Price | Title Company |
|---|---|---|---|
| Williams Revocable Trust | -- | Culpepper Tom L | |
| Williams Larry D | $87,900 | -- | |
| Goins David | $72,900 | -- | |
| Ball Betty D | $67,000 | City Title Company Agency In |
Source: Public Records
Mortgage History
| Date | Status | Borrower | Loan Amount |
|---|---|---|---|
| Previous Owner | Williams Larry D | $87,900 | |
| Previous Owner | Goins David | $69,255 | |
| Previous Owner | Ball Betty D | $37,000 |
Source: Public Records
Tax History Compared to Growth
Tax History
| Year | Tax Paid | Tax Assessment Tax Assessment Total Assessment is a certain percentage of the fair market value that is determined by local assessors to be the total taxable value of land and additions on the property. | Land | Improvement |
|---|---|---|---|---|
| 2024 | $2,589 | $49,690 | $10,010 | $39,680 |
| 2023 | $2,589 | $49,690 | $10,010 | $39,680 |
| 2022 | $2,279 | $34,720 | $7,000 | $27,720 |
| 2021 | $2,330 | $34,720 | $7,000 | $27,720 |
| 2020 | $2,324 | $34,720 | $7,000 | $27,720 |
| 2019 | $2,242 | $29,590 | $7,000 | $22,590 |
| 2018 | $2,249 | $29,590 | $7,000 | $22,590 |
| 2017 | $2,234 | $29,590 | $7,000 | $22,590 |
| 2016 | $2,166 | $27,960 | $7,000 | $20,960 |
| 2015 | $2,138 | $27,960 | $7,000 | $20,960 |
| 2014 | $2,138 | $27,960 | $7,000 | $20,960 |
| 2012 | -- | $30,140 | $8,750 | $21,390 |
Source: Public Records
Map
Nearby Homes
- 4848 Rittenhouse Dr
- 5431 Naughton Dr
- 5455 Naughton Dr
- 4918 Powell Rd
- 5669 Traymore Dr
- 4309 Kitridge Rd
- 5660 Tomberg St
- 5365 Mariner Dr
- 5433 Pentland Cir
- 4608 Nowak Ave
- 5952 Tibet Dr
- 5059 Key West Dr
- 5848 Tomberg St
- 4420 Kitridge Rd
- 5983 Harshmanville Rd
- 4407 Nowak Ave
- 5004 Fishburg Rd
- 5041 Pepper Dr
- 5784 Pennywell Dr
- 5159 Fishburg Rd
- 4812 Nelapark Dr
- 4824 Nelapark Dr
- 4831 Neptune Ln
- 4837 Neptune Ln
- 4830 Nelapark Dr
- 5492 Harshmanville Rd
- 4817 Nelapark Dr
- 4825 Neptune Ln
- 4843 Neptune Ln
- 5470 Harshmanville Rd
- 4807 Harshmanville Rd
- 4836 Nelapark Dr
- 4831 Nelapark Dr
- 5460 Harshmanville Rd
- 4849 Neptune Ln
- 4819 Neptune Ln
- 4810 Powell Rd
- 4816 Powell Rd
- 4842 Nelapark Dr
- 5560 Harshmanville Rd