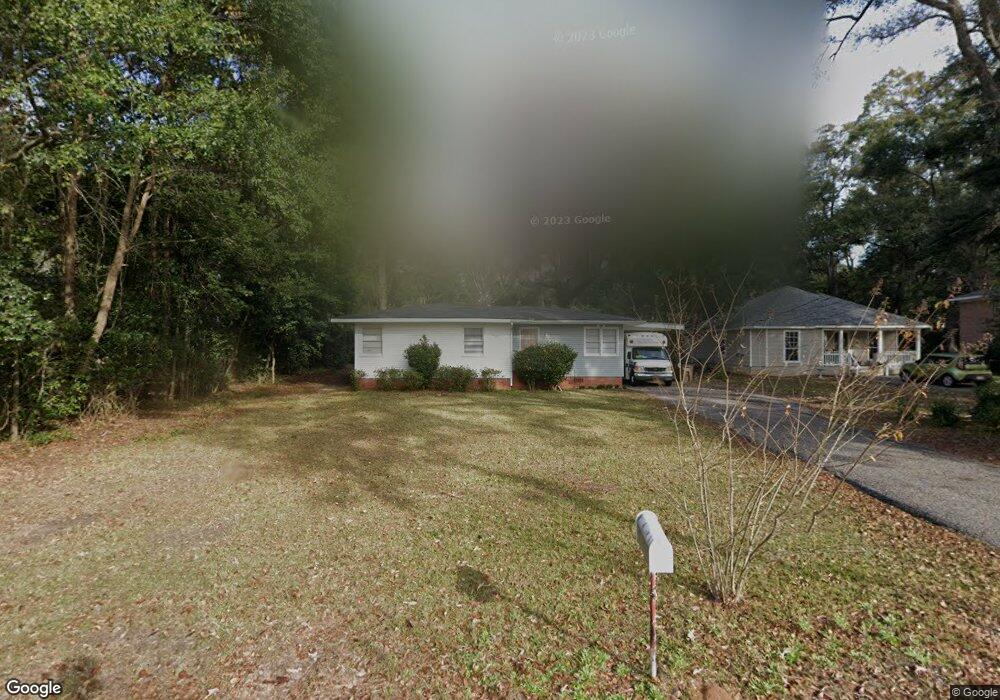
4818 Princeton Dr Mobile, AL 36618
Bellewood NeighborhoodEstimated Value: $115,980 - $157,000
3
Beds
1
Bath
1,045
Sq Ft
$128/Sq Ft
Est. Value
About This Home
This home is located at 4818 Princeton Dr, Mobile, AL 36618 and is currently estimated at $133,245, approximately $127 per square foot. 4818 Princeton Dr is a home located in Mobile County with nearby schools including Forest Hill Elementary School, CL Scarborough Middle School, and Mattie T Blount High School.
Ownership History
Date
Name
Owned For
Owner Type
Purchase Details
Closed on
Dec 24, 2019
Sold by
Nicholson Catherine T
Bought by
Pec12 Llc
Current Estimated Value
Purchase Details
Closed on
Oct 5, 2015
Sold by
Nicholson Catherine T
Bought by
Nicholson Catherine
Purchase Details
Closed on
Jan 12, 2010
Sold by
Hsbc Mortgage Services Inc
Bought by
Nicholson James W and Nicholson Catherine T
Home Financials for this Owner
Home Financials are based on the most recent Mortgage that was taken out on this home.
Original Mortgage
$34,875
Interest Rate
5.07%
Mortgage Type
Unknown
Purchase Details
Closed on
May 22, 2009
Sold by
Young Robert E
Bought by
Hsbc Mortgage Services Inc
Purchase Details
Closed on
Mar 9, 2006
Sold by
Taylor Allan G and Taylor Charlotte A
Bought by
Trest Kymberly A
Home Financials for this Owner
Home Financials are based on the most recent Mortgage that was taken out on this home.
Original Mortgage
$60,800
Interest Rate
6.19%
Mortgage Type
New Conventional
Create a Home Valuation Report for This Property
The Home Valuation Report is an in-depth analysis detailing your home's value as well as a comparison with similar homes in the area
Home Values in the Area
Average Home Value in this Area
Purchase History
We collect this data history from publicly available records. To have your information removed, we recommend requesting removal directly through your county’s website.
| Date | Buyer | Sale Price | Title Company |
|---|---|---|---|
| Pec12 Llc | -- | None Available | |
| Nicholson Catherine | $70,100 | None Available | |
| Nicholson James W | $46,500 | Slt | |
| Hsbc Mortgage Services Inc | $56,344 | None Available | |
| Trest Kymberly A | $76,000 | Gtc |
Source: Public Records
Mortgage History
We collect this data history from publicly available records. To have your information removed, we recommend requesting removal directly through your county’s website.
| Date | Status | Borrower | Loan Amount |
|---|---|---|---|
| Previous Owner | Nicholson James W | $34,875 | |
| Previous Owner | Trest Kymberly A | $60,800 |
Source: Public Records
Tax History
| Year | Tax Paid | Tax Assessment Tax Assessment Total Assessment is a certain percentage of the fair market value that is determined by local assessors to be the total taxable value of land and additions on the property. | Land | Improvement |
|---|---|---|---|---|
| 2025 | $1,049 | $16,360 | $4,000 | $12,360 |
| 2024 | $1,049 | $16,240 | $4,000 | $12,240 |
| 2023 | $970 | $15,280 | $4,140 | $11,140 |
| 2022 | $937 | $14,760 | $3,600 | $11,160 |
| 2021 | $842 | $13,260 | $3,600 | $9,660 |
| 2020 | $842 | $13,260 | $3,600 | $9,660 |
| 2019 | $838 | $13,200 | $3,600 | $9,600 |
| 2018 | $826 | $13,000 | $0 | $0 |
| 2017 | $826 | $13,000 | $0 | $0 |
| 2016 | $866 | $13,640 | $0 | $0 |
| 2013 | $960 | $14,020 | $0 | $0 |
Source: Public Records
Map
Nearby Homes
- 4900 Brooke Ct
- 4708 Belle Wood Dr S
- 1166 Harvard Dr
- 1309 Alicia Dr
- 1124 Forest Glen Dr N
- 1221 Garland St
- 5250 Marietta Dr S
- 1510 Northview Dr
- 1429 Forest Dale Dr
- 949 Knowles Ln
- 1118 Carre Dr W
- 1100 Bristol Ct
- 0 N University Blvd Unit 21441346
- 0 N University Blvd Unit 11675117
- 637 Tudor Ln W
- 637 Tudor Ln
- 902 Memory Ln
- 4305 Moffett Rd
- 524 Spring Park Dr E
- 483 Pine Ct
- 4816 Princeton Dr
- 4822 Princeton Dr
- 4811 Oxford Dr
- 4815 Oxford Dr
- 4824 Princeton Dr
- 0 Princeton Dr
- 1155 Forest Hill Dr
- 4806 Princeton Dr
- 4819 Oxford Dr
- 1159 Forest Hill Dr
- 4828 Princeton Dr
- 0 Oxford Dr Unit 1C 0526013
- 0 Oxford Dr Unit 1C
- 4821 Princeton Dr
- 4823 Oxford Dr
- 1163 Forest Hill Dr
- 4825 Princeton Dr
- 4825 Oxford Dr
- 4900 Princeton Dr
- 4814 Auburn Dr N
Your Personal Tour Guide
Ask me questions while you tour the home.