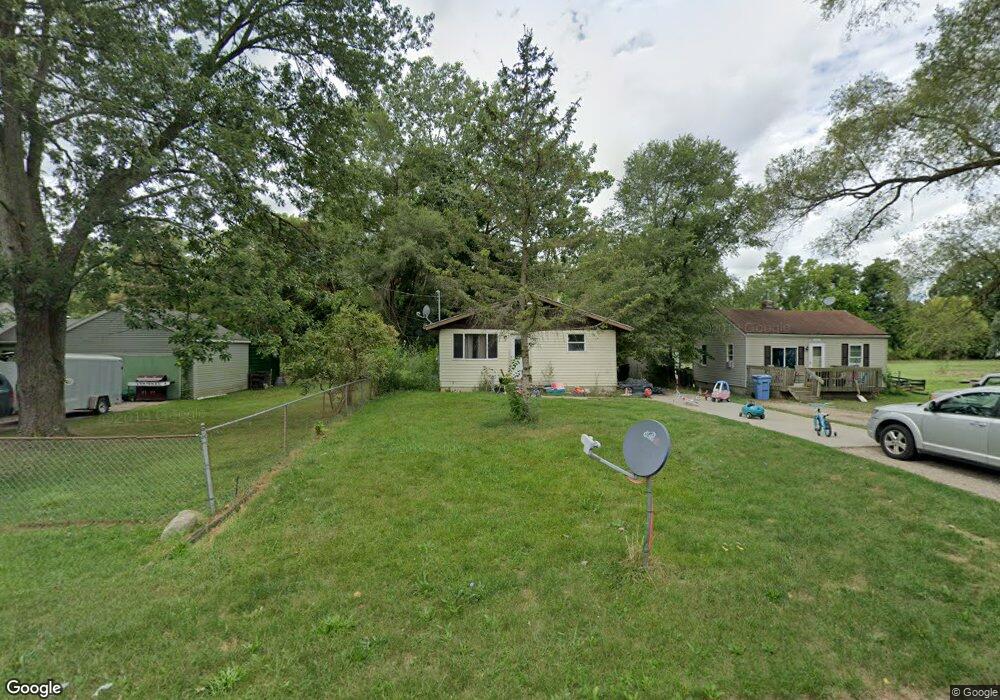
4818 Sidney St Lansing, MI 48911
Pleasant Grove NeighborhoodEstimated Value: $121,494 - $141,000
3
Beds
1
Bath
1,092
Sq Ft
$119/Sq Ft
Est. Value
About This Home
This home is located at 4818 Sidney St, Lansing, MI 48911 and is currently estimated at $130,124, approximately $119 per square foot. 4818 Sidney St is a home located in Ingham County with nearby schools including Reo Elementary School, Attwood School, and Everett High School.
Ownership History
Date
Name
Owned For
Owner Type
Purchase Details
Closed on
Apr 29, 2010
Sold by
Nona Najah
Bought by
Steve Llc
Current Estimated Value
Purchase Details
Closed on
Jan 29, 2009
Sold by
Deutsche Bank National Trust Company
Bought by
Nona Najah
Purchase Details
Closed on
Nov 29, 2007
Sold by
Smith Leslie Ann and Smith Ronald Edgar
Bought by
Deutsche Bank National Trust Co and Hsi Asset Securitization Corp Trust 2007
Purchase Details
Closed on
Nov 29, 2006
Sold by
Smith Ronald Edgar and Smith Leslie Ann
Bought by
Smith Ronald Edgar and Smith Leslie Ann
Home Financials for this Owner
Home Financials are based on the most recent Mortgage that was taken out on this home.
Original Mortgage
$50,000
Interest Rate
10.44%
Mortgage Type
Stand Alone Refi Refinance Of Original Loan
Purchase Details
Closed on
Jul 7, 2006
Sold by
Smith Gordon L and Smith Donna Lou
Bought by
Smith Ronald Edgar and Smith Leslie Ann
Create a Home Valuation Report for This Property
The Home Valuation Report is an in-depth analysis detailing your home's value as well as a comparison with similar homes in the area
Home Values in the Area
Average Home Value in this Area
Purchase History
| Date | Buyer | Sale Price | Title Company |
|---|---|---|---|
| Steve Llc | -- | None Available | |
| Nona Najah | $6,500 | Attorneys Title Agency Llc | |
| Deutsche Bank National Trust Co | $54,741 | None Available | |
| Smith Ronald Edgar | -- | Nations Title Agency | |
| Smith Ronald Edgar | -- | None Available |
Source: Public Records
Mortgage History
| Date | Status | Borrower | Loan Amount |
|---|---|---|---|
| Previous Owner | Smith Ronald Edgar | $50,000 |
Source: Public Records
Tax History Compared to Growth
Tax History
| Year | Tax Paid | Tax Assessment Tax Assessment Total Assessment is a certain percentage of the fair market value that is determined by local assessors to be the total taxable value of land and additions on the property. | Land | Improvement |
|---|---|---|---|---|
| 2025 | $2,601 | $54,100 | $10,200 | $43,900 |
| 2024 | $21 | $46,700 | $10,200 | $36,500 |
| 2023 | $2,448 | $40,500 | $10,200 | $30,300 |
| 2022 | $2,236 | $35,600 | $7,100 | $28,500 |
| 2021 | $2,185 | $33,900 | $5,300 | $28,600 |
| 2020 | $2,169 | $31,700 | $5,300 | $26,400 |
| 2019 | $2,867 | $30,600 | $5,300 | $25,300 |
| 2018 | $2,759 | $27,000 | $5,300 | $21,700 |
| 2017 | $1,987 | $27,000 | $5,300 | $21,700 |
| 2016 | $1,871 | $25,400 | $5,300 | $20,100 |
| 2015 | $1,871 | $24,600 | $10,566 | $14,034 |
| 2014 | $1,871 | $24,700 | $13,673 | $11,027 |
Source: Public Records
Map
Nearby Homes
- 4828 Ingham St
- 2416 Midwood St
- 4809 Ballard Rd
- 4628 Pleasant Grove Rd
- 3115 Risdale Ave
- 4110 Richmond St
- 2311 Greenbelt Dr
- 4620 Christiansen Rd
- 4017 Richmond St
- 2816 Greenbelt Dr
- 2045 Moffitt St
- 0 Midwood St
- 1729 Reo Rd
- 5100 Wexford Rd
- 3006 Hillcrest St
- 2029 Hillcrest St
- 3600 Ronald St
- 4916 Tressa Dr
- 4000 Churchill Ave
- 1420 Reo Rd