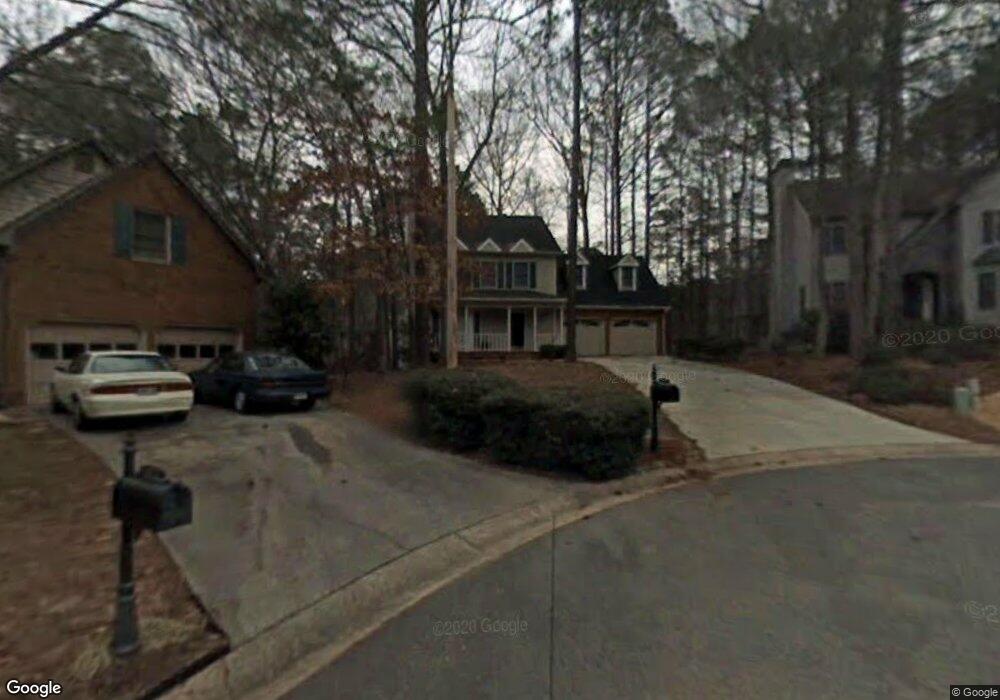
4818 Winding Ln Powder Springs, GA 30127
Estimated Value: $352,000 - $369,000
4
Beds
3
Baths
1,620
Sq Ft
$222/Sq Ft
Est. Value
About This Home
This home is located at 4818 Winding Ln, Powder Springs, GA 30127 and is currently estimated at $359,341, approximately $221 per square foot. 4818 Winding Ln is a home located in Cobb County with nearby schools including Tapp Middle School, McEachern High School, and Grace Baptist Christian School.
Ownership History
Date
Name
Owned For
Owner Type
Purchase Details
Closed on
Apr 8, 2013
Sold by
Mendez Charles G
Bought by
Mendez Derek M and Mendez Charles G
Current Estimated Value
Purchase Details
Closed on
Sep 24, 2004
Sold by
Federal Home Loan Mortgage Corporation
Bought by
Mendez Charles G
Home Financials for this Owner
Home Financials are based on the most recent Mortgage that was taken out on this home.
Original Mortgage
$20,250
Interest Rate
5.75%
Mortgage Type
New Conventional
Purchase Details
Closed on
Mar 2, 2004
Sold by
Chase Manhattan Mortgage Corp
Bought by
Federal Home Loan Mortgage Corporation
Purchase Details
Closed on
Nov 2, 2000
Sold by
Winkelman Gordon K
Bought by
Edwards Jason L and Edwards Virginia L
Home Financials for this Owner
Home Financials are based on the most recent Mortgage that was taken out on this home.
Original Mortgage
$143,450
Interest Rate
7.94%
Mortgage Type
New Conventional
Create a Home Valuation Report for This Property
The Home Valuation Report is an in-depth analysis detailing your home's value as well as a comparison with similar homes in the area
Home Values in the Area
Average Home Value in this Area
Purchase History
| Date | Buyer | Sale Price | Title Company |
|---|---|---|---|
| Mendez Derek M | -- | -- | |
| Mendez Charles G | -- | -- | |
| Federal Home Loan Mortgage Corporation | -- | -- | |
| Chase Manhattan Mortgage Corp | $158,916 | -- | |
| Edwards Jason L | $151,000 | -- |
Source: Public Records
Mortgage History
| Date | Status | Borrower | Loan Amount |
|---|---|---|---|
| Previous Owner | Mendez Charles G | $20,250 | |
| Previous Owner | Edwards Jason L | $143,450 |
Source: Public Records
Tax History Compared to Growth
Tax History
| Year | Tax Paid | Tax Assessment Tax Assessment Total Assessment is a certain percentage of the fair market value that is determined by local assessors to be the total taxable value of land and additions on the property. | Land | Improvement |
|---|---|---|---|---|
| 2025 | $3,736 | $124,000 | $24,000 | $100,000 |
| 2024 | $4,089 | $135,628 | $24,000 | $111,628 |
| 2023 | $4,089 | $135,628 | $24,000 | $111,628 |
| 2022 | $3,110 | $102,484 | $18,000 | $84,484 |
| 2021 | $2,640 | $86,988 | $18,000 | $68,988 |
| 2020 | $2,611 | $86,028 | $16,000 | $70,028 |
| 2019 | $2,324 | $76,560 | $16,000 | $60,560 |
| 2018 | $2,054 | $67,664 | $14,800 | $52,864 |
| 2017 | $1,945 | $67,664 | $14,800 | $52,864 |
| 2016 | $1,636 | $56,900 | $12,000 | $44,900 |
| 2015 | $1,676 | $56,900 | $12,000 | $44,900 |
| 2014 | $1,446 | $48,660 | $0 | $0 |
Source: Public Records
Map
Nearby Homes
- 4801 Deer Chase
- 4808 Winding Ln
- 3220 Way Unit 24
- 3258 Woodcliff Way
- 742 Crossroad Ct SW
- 4772 Deer Chase
- 4824 Buckhorn Ct
- 3389 Lochness Ln
- 3939 Ladiga St
- 4810 Hillside Ct
- 3071 Nectar Dr
- 3355 Timber Ridge
- 3130 Nectar Dr
- 0 Old Lost Mountain Rd Unit 10585149
- 0 Old Lost Mountain Rd Unit 7633273
- 5069 Glendora Dr
- 3073 Hopeland Dr
- 3164 Dowsing Ln
- 4816 Winding Ln
- 4820 Winding Ln Unit 3
- 3210 Country Walk Dr
- 3208 Country Walk Dr
- 4819 Winding Ln Unit 3
- 4814 Winding Ln
- 3212 Country Walk Dr
- 4797 Deer Chase Unit I
- 4817 Winding Ln
- 4799 Deer Chase
- 3206 Country Walk Dr
- 4815 Winding Ln
- 4803 Deer Chase
- 4812 Winding Ln
- 4813 Winding Ln
- 3204 Country Walk Dr
- 3216 Country Walk Dr
- 3211 Country Walk Dr
- 3209 Country Walk Dr
- 3213 Country Walk Dr Unit 1