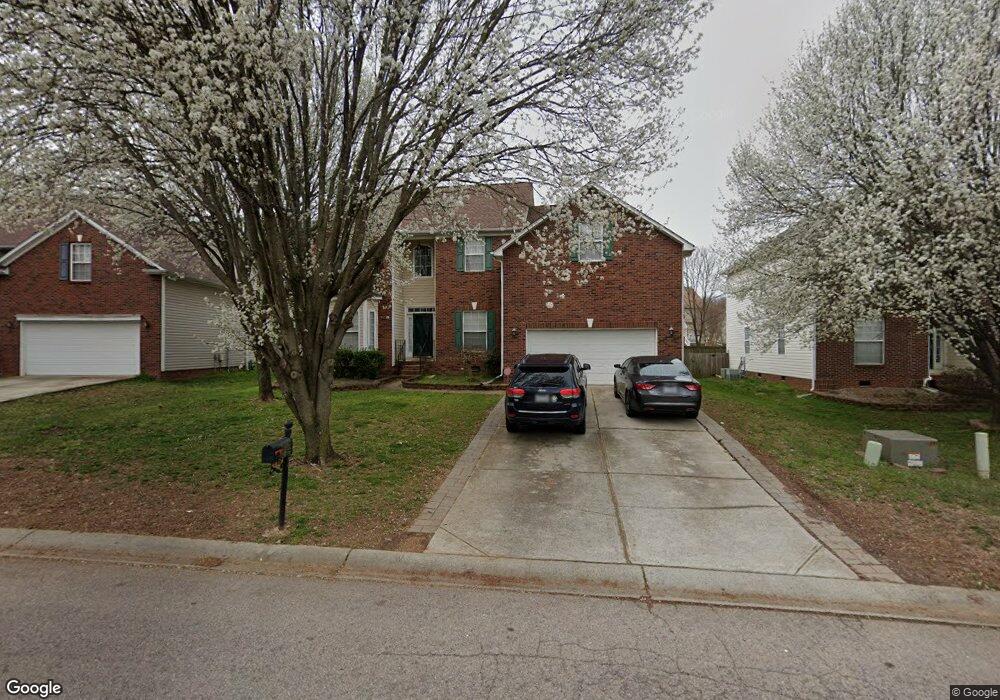
4819 Chesney St NW Concord, NC 28027
Estimated Value: $480,000 - $520,000
4
Beds
3
Baths
3,004
Sq Ft
$166/Sq Ft
Est. Value
About This Home
This home is located at 4819 Chesney St NW, Concord, NC 28027 and is currently estimated at $499,252, approximately $166 per square foot. 4819 Chesney St NW is a home located in Cabarrus County with nearby schools including Carl A. Furr Elementary School, Roberta Road Middle School, and Jay M. Robinson High School.
Ownership History
Date
Name
Owned For
Owner Type
Purchase Details
Closed on
Dec 12, 2002
Sold by
Solomon Collette Smith
Bought by
Smith Bobby L and Smith Leona A
Current Estimated Value
Home Financials for this Owner
Home Financials are based on the most recent Mortgage that was taken out on this home.
Original Mortgage
$102,500
Outstanding Balance
$43,521
Interest Rate
6.08%
Estimated Equity
$455,731
Purchase Details
Closed on
Mar 1, 2000
Sold by
Solomon Mark C and Solomon Mark Clayton
Bought by
Solomon Collette S and Solomon Collette Smith
Purchase Details
Closed on
Oct 23, 1998
Sold by
Cambridge Homes Of Nc Ltd Partnership
Bought by
Solomon Mark C and Solomon Collette S
Home Financials for this Owner
Home Financials are based on the most recent Mortgage that was taken out on this home.
Original Mortgage
$167,428
Interest Rate
6.76%
Create a Home Valuation Report for This Property
The Home Valuation Report is an in-depth analysis detailing your home's value as well as a comparison with similar homes in the area
Home Values in the Area
Average Home Value in this Area
Purchase History
| Date | Buyer | Sale Price | Title Company |
|---|---|---|---|
| Smith Bobby L | $202,500 | -- | |
| Solomon Collette S | -- | -- | |
| Solomon Mark C | $176,500 | -- |
Source: Public Records
Mortgage History
| Date | Status | Borrower | Loan Amount |
|---|---|---|---|
| Open | Smith Bobby L | $102,500 | |
| Previous Owner | Solomon Mark C | $167,428 |
Source: Public Records
Tax History Compared to Growth
Tax History
| Year | Tax Paid | Tax Assessment Tax Assessment Total Assessment is a certain percentage of the fair market value that is determined by local assessors to be the total taxable value of land and additions on the property. | Land | Improvement |
|---|---|---|---|---|
| 2025 | $4,786 | $480,570 | $90,000 | $390,570 |
| 2024 | $4,786 | $480,570 | $90,000 | $390,570 |
| 2023 | $3,481 | $285,340 | $55,000 | $230,340 |
| 2022 | $3,481 | $285,340 | $55,000 | $230,340 |
| 2021 | $3,481 | $285,340 | $55,000 | $230,340 |
| 2020 | $3,481 | $285,340 | $55,000 | $230,340 |
| 2019 | $2,525 | $206,950 | $33,000 | $173,950 |
| 2018 | $2,483 | $206,950 | $33,000 | $173,950 |
| 2017 | $2,442 | $206,950 | $33,000 | $173,950 |
| 2016 | $1,449 | $203,760 | $33,000 | $170,760 |
| 2015 | $2,404 | $203,760 | $33,000 | $170,760 |
| 2014 | $2,404 | $203,760 | $33,000 | $170,760 |
Source: Public Records
Map
Nearby Homes
- 4827 Chesney St NW
- 4831 Turnridge Ct NW
- 4803 Chesney St NW
- 4835 Chesney St NW
- 159 Pitts School Rd NW
- 4760 Lauren Glen St NW
- 4769 Covington Dr NW
- 2848 Ridge Crossing Ct NW
- 5711 Monticello Dr NW
- 2862 Walsh Dr NW Unit 99
- 5550 Monticello Dr NW
- 5811 Monticello Dr NW
- 5612 Meadow Bluff Ct NW
- 5807 Monticello Dr NW
- 00 Pitts School Rd
- 5899 Misty Forest Place NW
- 2967 Plantation Rd NW Unit 83
- 2974 Plantation Rd NW Unit 6
- 2924 Darwin Trail Unit 27
- 5772 Gettysburg Dr NW
- 4815 Chesney St NW
- 4823 Chesney St NW
- 4831 Brockton Ct NW
- 4833 Brockton Ct NW
- 4825 Chesney St NW
- 4825 Brockton Ct NW
- 4820 Chesney St NW
- 4837 Brockton Ct NW
- 4821 Brockton Ct NW
- 4809 Chesney St NW
- 4824 Chesney St NW
- 4818 Chesney St NW
- 4816 Chesney St NW
- 4828 Chesney St NW
- 4817 Brockton Ct NW
- 4807 Chesney St NW
- 4829 Chesney St NW
- 4840 Brockton Ct NW
- 4813 Brockton Ct NW
- 4830 Chesney St NW