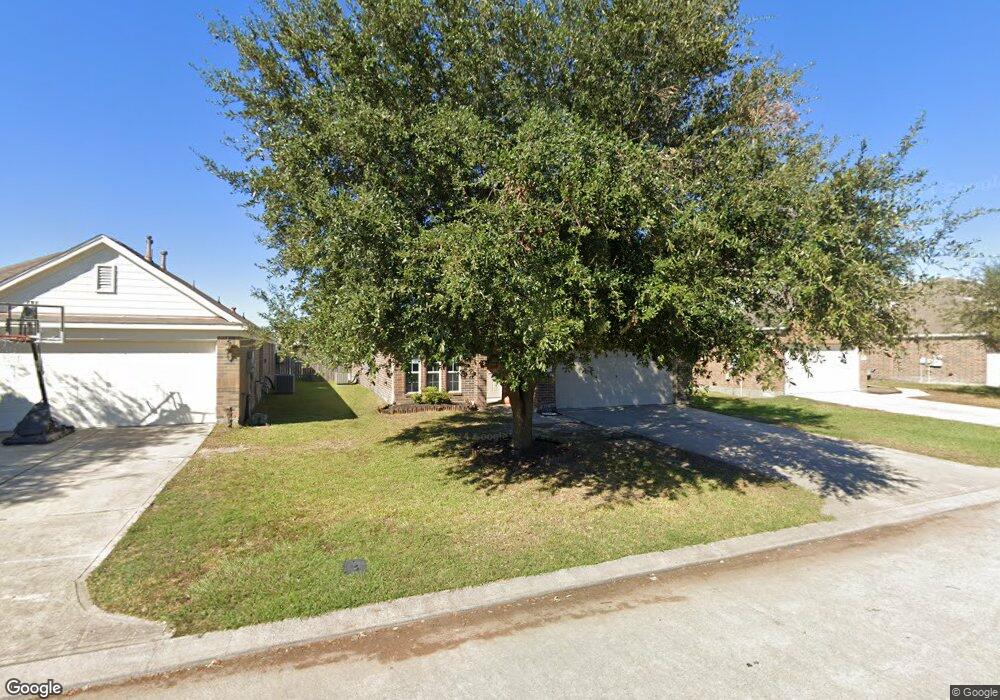
4819 Forest Hurst Glen Spring, TX 77373
Estimated Value: $230,000 - $257,000
3
Beds
2
Baths
1,568
Sq Ft
$152/Sq Ft
Est. Value
About This Home
This home is located at 4819 Forest Hurst Glen, Spring, TX 77373 and is currently estimated at $238,379, approximately $152 per square foot. 4819 Forest Hurst Glen is a home located in Harris County with nearby schools including Chet Burchett Elementary School, Ricky C. Bailey Middle School, and Spring High School.
Ownership History
Date
Name
Owned For
Owner Type
Purchase Details
Closed on
Apr 13, 2019
Sold by
Curtley Marissa Oliver
Bought by
Oliver Curtley Marissa
Current Estimated Value
Purchase Details
Closed on
Feb 16, 2016
Sold by
Cravy Nicholas
Bought by
Curtley Elijah P and Oliver Marissa
Home Financials for this Owner
Home Financials are based on the most recent Mortgage that was taken out on this home.
Original Mortgage
$141,855
Outstanding Balance
$111,857
Interest Rate
3.62%
Mortgage Type
FHA
Estimated Equity
$126,522
Purchase Details
Closed on
May 27, 2008
Sold by
Long Lake Ltd
Bought by
Cravy Nicholas
Home Financials for this Owner
Home Financials are based on the most recent Mortgage that was taken out on this home.
Original Mortgage
$106,329
Interest Rate
5.89%
Mortgage Type
FHA
Create a Home Valuation Report for This Property
The Home Valuation Report is an in-depth analysis detailing your home's value as well as a comparison with similar homes in the area
Home Values in the Area
Average Home Value in this Area
Purchase History
| Date | Buyer | Sale Price | Title Company |
|---|---|---|---|
| Oliver Curtley Marissa | -- | None Available | |
| Curtley Elijah P | -- | None Available | |
| Cravy Nicholas | -- | American Title Company |
Source: Public Records
Mortgage History
| Date | Status | Borrower | Loan Amount |
|---|---|---|---|
| Open | Curtley Elijah P | $141,855 | |
| Previous Owner | Cravy Nicholas | $106,329 |
Source: Public Records
Tax History Compared to Growth
Tax History
| Year | Tax Paid | Tax Assessment Tax Assessment Total Assessment is a certain percentage of the fair market value that is determined by local assessors to be the total taxable value of land and additions on the property. | Land | Improvement |
|---|---|---|---|---|
| 2025 | $5,808 | $227,398 | $45,150 | $182,248 |
| 2024 | $5,808 | $220,653 | $45,150 | $175,503 |
| 2023 | $5,808 | $232,257 | $40,950 | $191,307 |
| 2022 | $5,415 | $200,843 | $19,950 | $180,893 |
| 2021 | $4,514 | $160,556 | $19,950 | $140,606 |
| 2020 | $4,290 | $144,754 | $19,950 | $124,804 |
| 2019 | $4,363 | $142,582 | $19,950 | $122,632 |
| 2018 | $4,102 | $135,816 | $19,950 | $115,866 |
| 2017 | $4,126 | $135,816 | $19,950 | $115,866 |
| 2016 | $3,987 | $131,238 | $19,950 | $111,288 |
| 2015 | $3,669 | $124,105 | $19,950 | $104,155 |
| 2014 | $3,669 | $115,767 | $19,950 | $95,817 |
Source: Public Records
Map
Nearby Homes
- 3218 Dappled Vale Trail
- 3226 Dappled Vale Trail
- 4822 Edgegate Dr
- 3306 Forest Chitto Dr
- Plan 133 at Breckenridge Park
- Plan 142 at Breckenridge Park
- Plan 140 at Breckenridge Park
- Plan 264 at Breckenridge Park
- Plan 265 at Breckenridge Park
- Plan 254 at Breckenridge Park
- Plan 146 at Breckenridge Park
- Plan 141 at Breckenridge Park
- Plan 217 at Breckenridge Park
- 23411 Breckenridge Dale Ln
- Plan 262 at Breckenridge Park
- Plan 135 at Breckenridge Park
- Plan 218 at Breckenridge Park
- Plan 148 at Breckenridge Park
- Plan 252 at Breckenridge Park
- Plan 143 at Breckenridge Park
- 4815 Forest Hurst Glen
- 4823 Forest Hurst Glen
- 4827 Forest Hurst Glen
- 24234 Bentgate Dr
- 4811 Forest Hurst Glen
- 24230 Bentgate Dr
- 4831 Forest Hurst Glen
- 4807 Forest Hurst Glen
- 24235 Bentgate Dr
- 24226 Bentgate Dr
- 4803 Forest Hurst Glen
- 4902 Cypress Hurst
- 4835 Forest Hurst Glen
- 24231 Bentgate Dr
- 4906 Cypress Hurst
- 24227 Bentgate Dr
- 24222 Bentgate Dr
- 4910 Cypress Hurst
- 4727 Forest Hurst Glen
- 4903 Forest Hurst Glen