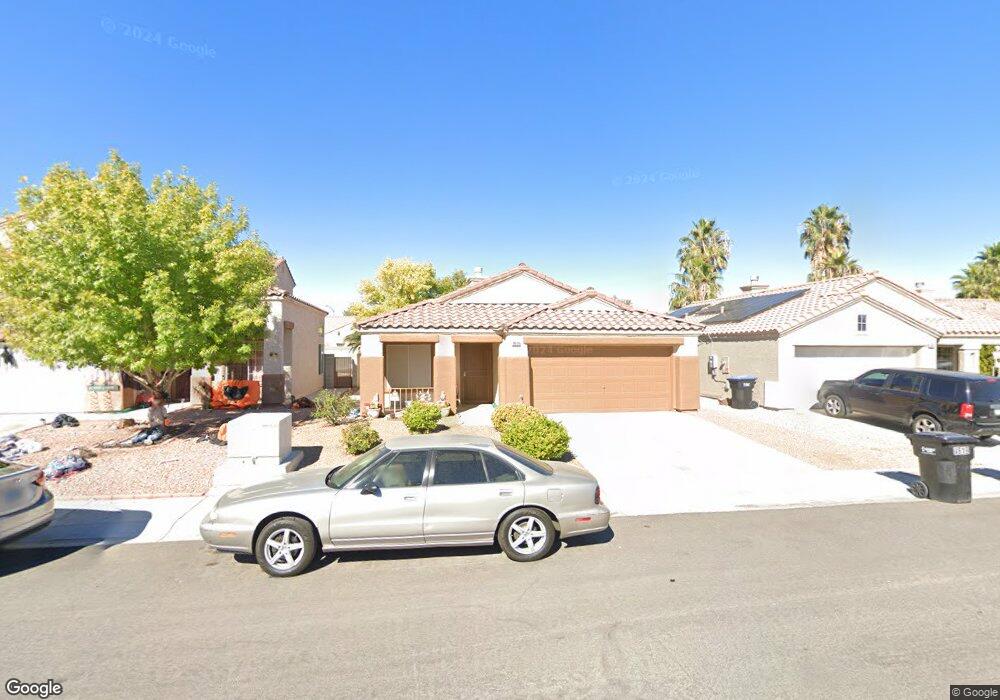
4819 Via Maria Ct North Las Vegas, NV 89031
Craig Ranch NeighborhoodEstimated Value: $313,000 - $408,000
3
Beds
2
Baths
1,298
Sq Ft
$282/Sq Ft
Est. Value
About This Home
This home is located at 4819 Via Maria Ct, North Las Vegas, NV 89031 and is currently estimated at $365,634, approximately $281 per square foot. 4819 Via Maria Ct is a home located in Clark County with nearby schools including Raul P. Elizondo Elementary School, Clifford O. Findlay Middle School, and Mojave High School.
Ownership History
Date
Name
Owned For
Owner Type
Purchase Details
Closed on
Dec 21, 2023
Sold by
Larry Luther Llc
Bought by
Luther Ruocco Family Trust and Luther
Current Estimated Value
Purchase Details
Closed on
Jan 7, 2023
Sold by
Luther Ruocco Llc
Bought by
Larry Luther Llc
Purchase Details
Closed on
Feb 8, 2006
Sold by
Luther Laurence
Bought by
Luther Ruocco Llc
Purchase Details
Closed on
Oct 7, 2002
Sold by
Luther Nancy
Bought by
Luther Laurence
Purchase Details
Closed on
Feb 6, 2002
Sold by
Mash Allen
Bought by
Luther Nancy
Purchase Details
Closed on
Aug 16, 1996
Sold by
Kaufman & Broad Of Nevada Inc
Bought by
Mash Allen L and Luther Nancy E
Home Financials for this Owner
Home Financials are based on the most recent Mortgage that was taken out on this home.
Original Mortgage
$106,851
Interest Rate
8.18%
Mortgage Type
FHA
Create a Home Valuation Report for This Property
The Home Valuation Report is an in-depth analysis detailing your home's value as well as a comparison with similar homes in the area
Home Values in the Area
Average Home Value in this Area
Purchase History
| Date | Buyer | Sale Price | Title Company |
|---|---|---|---|
| Luther Ruocco Family Trust | -- | None Listed On Document | |
| Larry Luther Llc | $224,883 | -- | |
| Luther Ruocco Llc | -- | None Available | |
| Luther Laurence | $114,890 | -- | |
| Luther Nancy | -- | -- | |
| Mash Allen L | $108,500 | Nevada Title Company |
Source: Public Records
Mortgage History
| Date | Status | Borrower | Loan Amount |
|---|---|---|---|
| Previous Owner | Mash Allen L | $106,851 |
Source: Public Records
Tax History Compared to Growth
Tax History
| Year | Tax Paid | Tax Assessment Tax Assessment Total Assessment is a certain percentage of the fair market value that is determined by local assessors to be the total taxable value of land and additions on the property. | Land | Improvement |
|---|---|---|---|---|
| 2025 | $1,392 | $83,475 | $30,100 | $53,375 |
| 2024 | $1,290 | $83,475 | $30,100 | $53,375 |
| 2023 | $1,290 | $78,709 | $28,000 | $50,709 |
| 2022 | $1,195 | $68,651 | $22,050 | $46,601 |
| 2021 | $1,106 | $65,428 | $21,000 | $44,428 |
| 2020 | $1,024 | $64,035 | $19,950 | $44,085 |
| 2019 | $960 | $58,879 | $15,400 | $43,479 |
| 2018 | $916 | $54,405 | $12,250 | $42,155 |
| 2017 | $1,701 | $50,719 | $10,850 | $39,869 |
| 2016 | $859 | $44,875 | $8,400 | $36,475 |
| 2015 | $858 | $34,789 | $5,950 | $28,839 |
| 2014 | $831 | $25,810 | $4,900 | $20,910 |
Source: Public Records
Map
Nearby Homes
- 4822 Con Carne Ct
- 4784 Wild Draw Dr
- 4915 Via Luis Ct
- 4762 Wild Draw Dr
- 4744 Big Draw Dr
- 5038 Vista Del Rio Way
- 908 Cypress Gold Ct
- 13 Deseo Ct
- 4717 Cedar Ranch Ct
- 524 Rancho Del Sol Way
- 3601 Allen Creek Ct
- 5136 Stonecrop St
- 4606 Pointleaf St
- 1038 Solemn Cactus Ave
- 17 Deseo Ct
- 4752 Cactus Sun Ln
- 1132 Turnstone Ct
- 5243 Willowdale Ct
- 950 Willow Berry Ave
- 5228 Daywood St
- 4815 Via Maria Ct
- 4823 Via Maria Ct
- 4823 Via Maria Ct Unit n/a
- 4827 Via Maria Ct
- 4811 Via Maria Ct
- 4922 Rancho Domingo Ct Unit 4
- 4918 Rancho Domingo Ct
- 4926 Rancho Domingo Ct
- 4914 Rancho Domingo Ct
- 4831 Via Maria Ct
- 4930 Rancho Domingo Ct
- 4818 Via Maria Ct
- 4822 Via Maria Ct
- 4814 Via Maria Ct
- 4814 Via Maria Ct Unit none
- 4910 Rancho Domingo Ct
- 4807 Via Maria Ct
- 4826 Via Maria Ct
- 4934 Rancho Domingo Ct
- 4810 Via Maria Ct