Estimated Value: $91,655 - $108,000
1
Bed
1
Bath
600
Sq Ft
$162/Sq Ft
Est. Value
About This Home
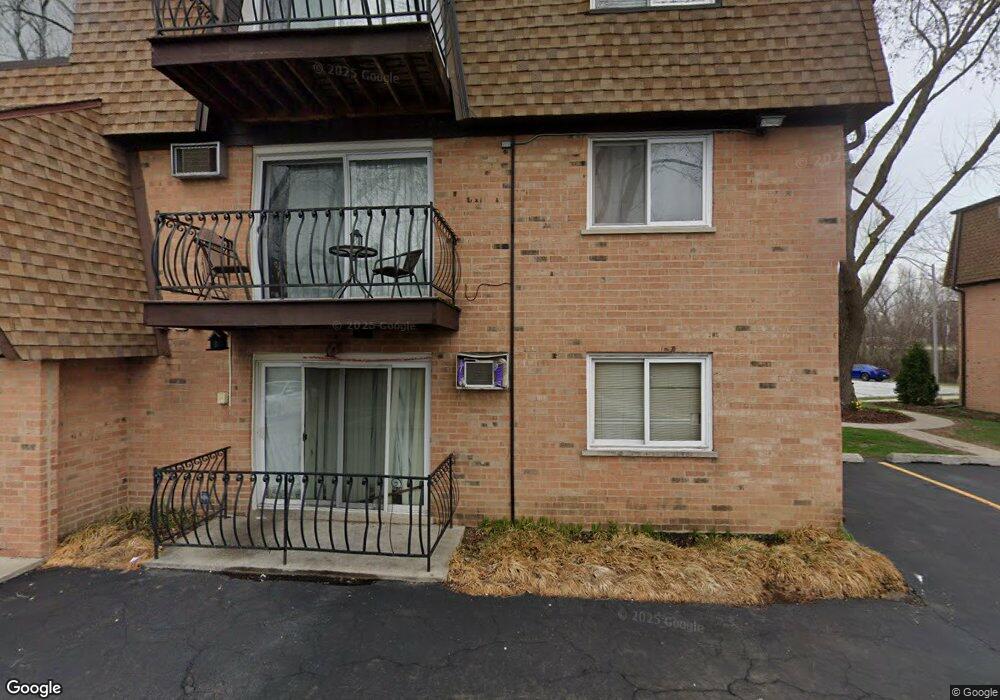
This home is located at 4819 W Engle Rd Unit 4819, Alsip, IL 60803 and is currently estimated at $97,414, approximately $162 per square foot. 4819 W Engle Rd Unit 4819 is a home located in Cook County with nearby schools including Nathan Hale Primary School, Nathan Hale Intermediate School, and Nathan Hale Middle School.
Ownership History
Date
Name
Owned For
Owner Type
Purchase Details
Closed on
Jun 13, 2017
Sold by
Czubernat Michael W
Bought by
Czubernat Michael W and Michael W Czubernat Decalration Of Trust
Current Estimated Value
Purchase Details
Closed on
Sep 19, 2005
Sold by
Salomone Joseph and Salomone Ann
Bought by
Czubernat Michael W
Home Financials for this Owner
Home Financials are based on the most recent Mortgage that was taken out on this home.
Original Mortgage
$52,850
Outstanding Balance
$28,239
Interest Rate
5.83%
Mortgage Type
Fannie Mae Freddie Mac
Estimated Equity
$69,175
Purchase Details
Closed on
Sep 13, 2002
Sold by
First Midwest Bank
Bought by
Salomone Joseph and Salomone Ann
Home Financials for this Owner
Home Financials are based on the most recent Mortgage that was taken out on this home.
Original Mortgage
$52,550
Interest Rate
6.24%
Create a Home Valuation Report for This Property
The Home Valuation Report is an in-depth analysis detailing your home's value as well as a comparison with similar homes in the area
Home Values in the Area
Average Home Value in this Area
Purchase History
| Date | Buyer | Sale Price | Title Company |
|---|---|---|---|
| Czubernat Michael W | -- | Attorney | |
| Czubernat Michael W | $75,500 | First American Title Ins Co | |
| Salomone Joseph | $59,000 | -- |
Source: Public Records
Mortgage History
| Date | Status | Borrower | Loan Amount |
|---|---|---|---|
| Open | Czubernat Michael W | $52,850 | |
| Previous Owner | Salomone Joseph | $52,550 |
Source: Public Records
Tax History Compared to Growth
Tax History
| Year | Tax Paid | Tax Assessment Tax Assessment Total Assessment is a certain percentage of the fair market value that is determined by local assessors to be the total taxable value of land and additions on the property. | Land | Improvement |
|---|---|---|---|---|
| 2024 | $1,144 | $6,500 | $726 | $5,774 |
| 2023 | $315 | $6,500 | $726 | $5,774 |
| 2022 | $315 | $4,145 | $1,056 | $3,089 |
| 2021 | $337 | $4,144 | $1,056 | $3,088 |
| 2020 | $486 | $4,304 | $1,056 | $3,248 |
| 2019 | $88 | $3,641 | $957 | $2,684 |
| 2018 | $83 | $3,641 | $957 | $2,684 |
| 2017 | $109 | $3,641 | $957 | $2,684 |
| 2016 | $146 | $2,847 | $792 | $2,055 |
| 2015 | $91 | $2,847 | $792 | $2,055 |
| 2014 | $1,221 | $5,647 | $792 | $4,855 |
| 2013 | $917 | $5,153 | $792 | $4,361 |
Source: Public Records
Map
Nearby Homes
- 4654 W 131st St Unit 1S
- 12824 S Kenneth Ave Unit F1
- 12738 S Kenneth Ave Unit E
- 12736 S Kenneth Ave Unit 1A
- 4406 W 127th Place
- 4343 W Emerald Way St
- 4336 W Emerald Way St
- 4326 W Emerald Way St
- 12954 Crescent Ct
- 13300 W Circle Drive Pkwy Unit G222
- 4955 134th Place Unit 1B
- 4955 134th Place Unit 3B
- 4920 134th Ct Unit 206
- 4920 134th Ct Unit 207
- 4818 W 122nd St Unit 3W
- 4735 W 122nd St
- 12507 S Tripp Ave
- 13426 W Circle Dr Unit 302
- 13412 Le Claire Ave
- 12147 S Cicero Ave
- 4819 W Engle Rd Unit 1A
- 4809 W Engle Rd Unit 4809
- 4819 W Engle Rd Unit 4819
- 4819 W Engle Rd Unit 4819
- 4819 W Engle Rd Unit 4819
- 4809 W Engle Rd Unit 4809
- 4809 W Engle Rd Unit 4809
- 4809 W Engle Rd Unit 4809
- 4809 W Engle Rd Unit 4809
- 4819 W Engle Rd Unit 4819
- 4809 W Engle Rd Unit 4809
- 4809 W Engle Rd Unit 4809
- 4819 W Engle Rd Unit 4819
- 4809 W Engle Rd Unit 4809
- 4809 W Engle Rd Unit 4809
- 4809 W Engle Rd Unit 4809
- 4809 W Engle Rd Unit 4809
- 4819 W Engle Rd Unit 4819
- 4819 W Engle Rd Unit 4819
- 4819 W Engle Rd Unit 4819