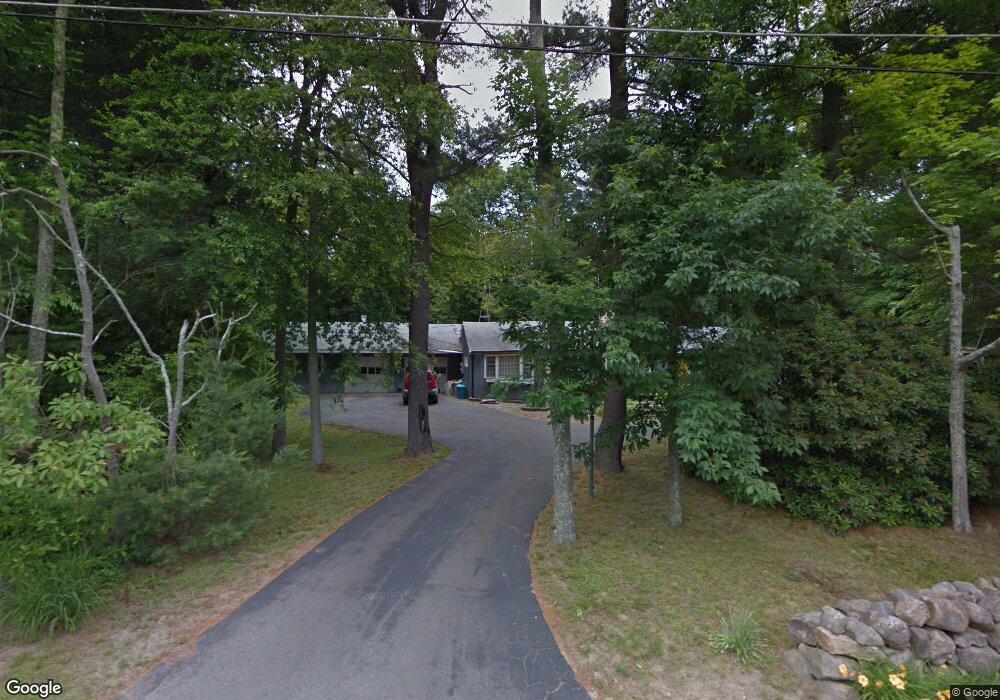
482 High St Hanson, MA 02341
Estimated Value: $354,000 - $879,000
4
Beds
3
Baths
2,528
Sq Ft
$221/Sq Ft
Est. Value
About This Home
This home is located at 482 High St, Hanson, MA 02341 and is currently estimated at $559,612, approximately $221 per square foot. 482 High St is a home located in Plymouth County.
Ownership History
Date
Name
Owned For
Owner Type
Purchase Details
Closed on
Nov 10, 1988
Sold by
Stephens Brian M
Bought by
Stephens Brian M
Current Estimated Value
Home Financials for this Owner
Home Financials are based on the most recent Mortgage that was taken out on this home.
Original Mortgage
$135,000
Interest Rate
10.36%
Mortgage Type
Purchase Money Mortgage
Purchase Details
Closed on
Nov 7, 1988
Sold by
Stephens Brian M
Bought by
Stephens Brian M
Home Financials for this Owner
Home Financials are based on the most recent Mortgage that was taken out on this home.
Original Mortgage
$135,000
Interest Rate
10.36%
Mortgage Type
Purchase Money Mortgage
Create a Home Valuation Report for This Property
The Home Valuation Report is an in-depth analysis detailing your home's value as well as a comparison with similar homes in the area
Home Values in the Area
Average Home Value in this Area
Purchase History
| Date | Buyer | Sale Price | Title Company |
|---|---|---|---|
| Stephens Brian M | $30,000 | -- | |
| Stephens Brian M | $30,000 | -- |
Source: Public Records
Mortgage History
| Date | Status | Borrower | Loan Amount |
|---|---|---|---|
| Open | Stephens Brian M | $101,100 | |
| Closed | Stephens Brian M | $135,000 | |
| Closed | Stephens Brian M | $135,000 |
Source: Public Records
Tax History
| Year | Tax Paid | Tax Assessment Tax Assessment Total Assessment is a certain percentage of the fair market value that is determined by local assessors to be the total taxable value of land and additions on the property. | Land | Improvement |
|---|---|---|---|---|
| 2025 | $6,178 | $461,700 | $183,300 | $278,400 |
| 2024 | $6,075 | $454,000 | $178,000 | $276,000 |
| 2023 | $6,002 | $423,300 | $178,000 | $245,300 |
| 2022 | $5,838 | $386,900 | $161,800 | $225,100 |
| 2021 | $5,364 | $355,200 | $155,600 | $199,600 |
| 2020 | $5,299 | $347,000 | $150,300 | $196,700 |
| 2019 | $5,122 | $329,800 | $147,400 | $182,400 |
| 2018 | $5,075 | $320,600 | $141,800 | $178,800 |
| 2017 | $4,930 | $308,500 | $135,000 | $173,500 |
| 2016 | $4,982 | $301,000 | $135,000 | $166,000 |
| 2015 | $4,738 | $297,600 | $135,000 | $162,600 |
Source: Public Records
Map
Nearby Homes
- Lot 6 Way
- Lot 2 Harvard Rd
- 361A County Rd
- 361 County Rd
- 80 Phillips St
- 72 Phillips St
- 1054 Main St
- 61 Sawmill Ln
- 61 Sawmill Ln Unit 61
- 161 Winter St Unit 11
- 84 Liberty St
- Lot 5 Princeton Way
- 26 Franklin St
- 127 Crescent Place
- 134 Crescent St
- 126-130 Franklin St
- 1754 Central St
- 724 Whitman St
- 269 Lakeside Rd
- 170 Elm St
Your Personal Tour Guide
Ask me questions while you tour the home.