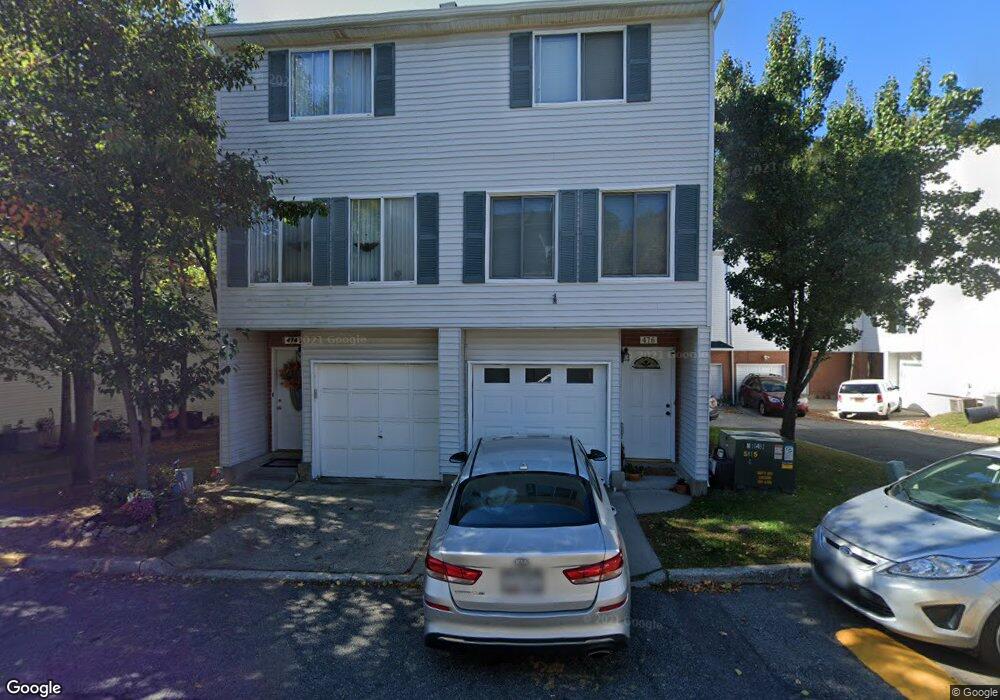
482 Ilyssa Way Staten Island, NY 10312
Arden Heights NeighborhoodEstimated Value: $521,000 - $552,441
3
Beds
4
Baths
1,510
Sq Ft
$355/Sq Ft
Est. Value
About This Home
This home is located at 482 Ilyssa Way, Staten Island, NY 10312 and is currently estimated at $535,860, approximately $354 per square foot. 482 Ilyssa Way is a home located in Richmond County with nearby schools including P.S. 58R Space Shuttle Columbia School, I.S. 075 Frank D. Paulo, and Tottenville High School.
Ownership History
Date
Name
Owned For
Owner Type
Purchase Details
Closed on
Jul 31, 2008
Sold by
Dennis Andrew W
Bought by
Gasway John
Current Estimated Value
Home Financials for this Owner
Home Financials are based on the most recent Mortgage that was taken out on this home.
Original Mortgage
$283,765
Outstanding Balance
$185,877
Interest Rate
6.29%
Mortgage Type
Purchase Money Mortgage
Estimated Equity
$349,983
Purchase Details
Closed on
Feb 5, 2004
Sold by
Brennan Patrick J and Brennan Roni
Bought by
Dennis Andrew W
Home Financials for this Owner
Home Financials are based on the most recent Mortgage that was taken out on this home.
Original Mortgage
$100,000
Interest Rate
5.83%
Mortgage Type
Purchase Money Mortgage
Purchase Details
Closed on
Nov 13, 1997
Sold by
Aspen Knolls Corp
Bought by
Brennan Patrick J and Brennan Roni J
Create a Home Valuation Report for This Property
The Home Valuation Report is an in-depth analysis detailing your home's value as well as a comparison with similar homes in the area
Home Values in the Area
Average Home Value in this Area
Purchase History
| Date | Buyer | Sale Price | Title Company |
|---|---|---|---|
| Gasway John | $298,700 | None Available | |
| Dennis Andrew W | $215,000 | First American Title Insuran | |
| Brennan Patrick J | $100,500 | Chicago Title Insurance Co |
Source: Public Records
Mortgage History
| Date | Status | Borrower | Loan Amount |
|---|---|---|---|
| Open | Gasway John | $283,765 | |
| Previous Owner | Dennis Andrew W | $100,000 |
Source: Public Records
Tax History Compared to Growth
Tax History
| Year | Tax Paid | Tax Assessment Tax Assessment Total Assessment is a certain percentage of the fair market value that is determined by local assessors to be the total taxable value of land and additions on the property. | Land | Improvement |
|---|---|---|---|---|
| 2025 | $3,150 | $29,820 | $1,773 | $28,047 |
| 2024 | $3,150 | $25,140 | $1,984 | $23,156 |
| 2023 | $3,184 | $15,677 | $1,867 | $13,810 |
| 2022 | $3,107 | $24,660 | $3,180 | $21,480 |
| 2021 | $3,090 | $24,720 | $3,180 | $21,540 |
| 2020 | $2,932 | $23,940 | $3,180 | $20,760 |
| 2019 | $2,734 | $22,440 | $3,180 | $19,260 |
| 2018 | $2,663 | $13,064 | $2,036 | $11,028 |
| 2017 | $2,644 | $12,969 | $2,268 | $10,701 |
| 2016 | $2,446 | $12,236 | $2,291 | $9,945 |
| 2015 | $2,090 | $11,544 | $1,860 | $9,684 |
| 2014 | $2,090 | $10,891 | $1,924 | $8,967 |
Source: Public Records
Map
Nearby Homes
- 512 Ilyssa Way
- 453 Ilyssa Way
- 217 Emily Ln
- 439 Ilyssa Way
- 355 Ilyssa Way
- 362 Ilyssa Way
- 305 Ilyssa Way
- 78 Emily Ln
- 670 Ilyssa Way
- 217 Jamie Ln
- 287 Jamie Ln
- 235 Ilyssa Way
- 263 Jamie Ln
- 400 Aspen Knolls Way Unit B2
- 214 Ilyssa Way
- 192 Ilyssa Way
- 34 Jamie Ln
- 49 Jamie Ln
- 171 Aspen Knolls Way
- 42 Amanda Ct
- 480 Ilyssa Way
- 486 Ilyssa Way
- 476 Ilyssa Way
- 474 Ilyssa Way
- 488 Ilyssa Way
- 454 Ilyssa Way
- 496 Ilyssa Way
- 456 Ilyssa Way Unit 317
- 492 Ilyssa Way
- 462 Ilyssa Way
- 460 Ilyssa Way
- 498 Ilyssa Way
- 450 Ilyssa Way
- 504 Ilyssa Way
- 500 Ilyssa Way
- 448 Ilyssa Way
- 473 Ilyssa Way
- 475 Ilyssa Way
- 506 Ilyssa Way
- 497 Ilyssa Way Unit 284