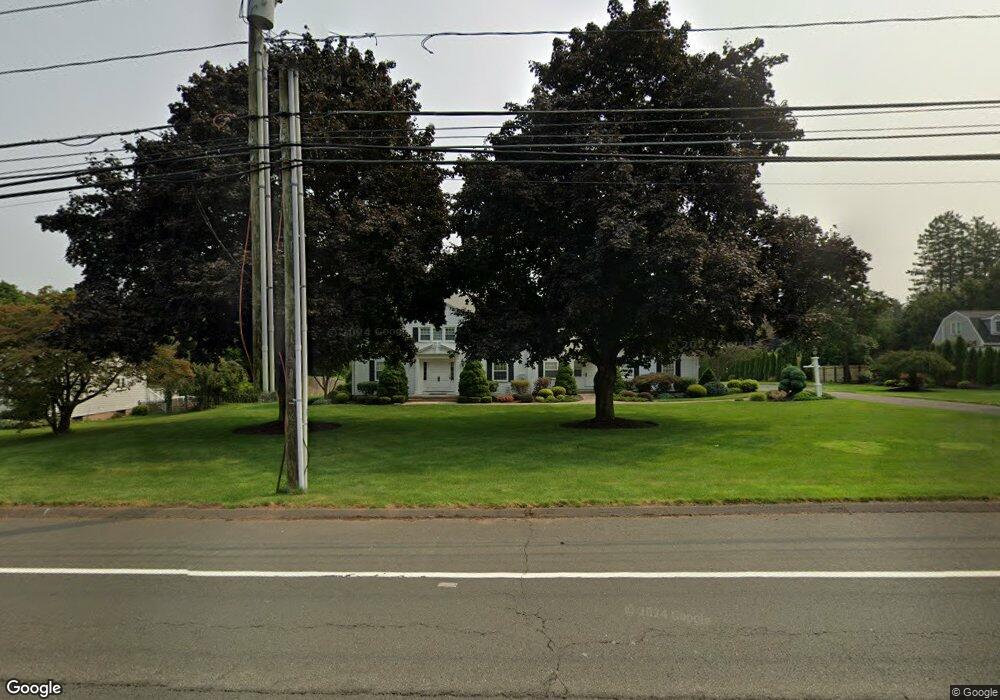
482 Main St Cromwell, CT 06416
Estimated Value: $571,000 - $697,000
4
Beds
4
Baths
2,633
Sq Ft
$245/Sq Ft
Est. Value
About This Home
This home is located at 482 Main St, Cromwell, CT 06416 and is currently estimated at $645,442, approximately $245 per square foot. 482 Main St is a home located in Middlesex County with nearby schools including Edna C. Stevens School, Woodside Intermediate School, and Cromwell Middle School.
Ownership History
Date
Name
Owned For
Owner Type
Purchase Details
Closed on
Feb 13, 2006
Sold by
Cider Hill Assoc Llc
Bought by
Dolan John D and Hull-Dolan Lisa A
Current Estimated Value
Purchase Details
Closed on
Aug 26, 2005
Sold by
Barber Charlene A
Bought by
Cider Hill Assoc Llc
Create a Home Valuation Report for This Property
The Home Valuation Report is an in-depth analysis detailing your home's value as well as a comparison with similar homes in the area
Home Values in the Area
Average Home Value in this Area
Purchase History
| Date | Buyer | Sale Price | Title Company |
|---|---|---|---|
| Dolan John D | $350,000 | -- | |
| Cider Hill Assoc Llc | $425,000 | -- | |
| Dolan John D | $350,000 | -- | |
| Cider Hill Assoc Llc | $425,000 | -- |
Source: Public Records
Mortgage History
| Date | Status | Borrower | Loan Amount |
|---|---|---|---|
| Open | Cider Hill Assoc Llc | $66,500 | |
| Open | Cider Hill Assoc Llc | $328,000 | |
| Closed | Cider Hill Assoc Llc | $235,950 |
Source: Public Records
Tax History Compared to Growth
Tax History
| Year | Tax Paid | Tax Assessment Tax Assessment Total Assessment is a certain percentage of the fair market value that is determined by local assessors to be the total taxable value of land and additions on the property. | Land | Improvement |
|---|---|---|---|---|
| 2025 | $8,554 | $277,830 | $65,660 | $212,170 |
| 2024 | $8,354 | $277,830 | $65,660 | $212,170 |
| 2023 | $8,171 | $277,830 | $65,660 | $212,170 |
| 2022 | $7,779 | $233,380 | $62,860 | $170,520 |
| 2021 | $7,779 | $233,380 | $62,860 | $170,520 |
| 2020 | $7,662 | $233,380 | $62,860 | $170,520 |
| 2019 | $7,662 | $233,380 | $62,860 | $170,520 |
| 2018 | $7,662 | $233,380 | $62,860 | $170,520 |
| 2017 | $7,146 | $210,620 | $53,750 | $156,870 |
| 2016 | $7,083 | $210,620 | $53,750 | $156,870 |
| 2015 | $6,609 | $210,620 | $53,750 | $156,870 |
| 2014 | $7,009 | $210,620 | $53,750 | $156,870 |
Source: Public Records
Map
Nearby Homes
- 21 Crest Dr
- 20 Evergreen Rd
- 12 Fairview Heights
- 15 Oxford Ln
- 5 Shelley St
- 3 W Street Heights
- 23 Primrose Ln
- 18 W Street Terrace
- 27 Primrose Ln
- 17 Oakwood Manor
- 35 Primrose Ln
- 587 Main St
- 5 Palmer Cir
- 30 Larkspur Dr
- 8 Mohawk Ct
- 33 Lincoln Rd
- 120 Washington Rd
- 63 Timber Hill Rd
- 291 Main St
- 188 Woodland Dr