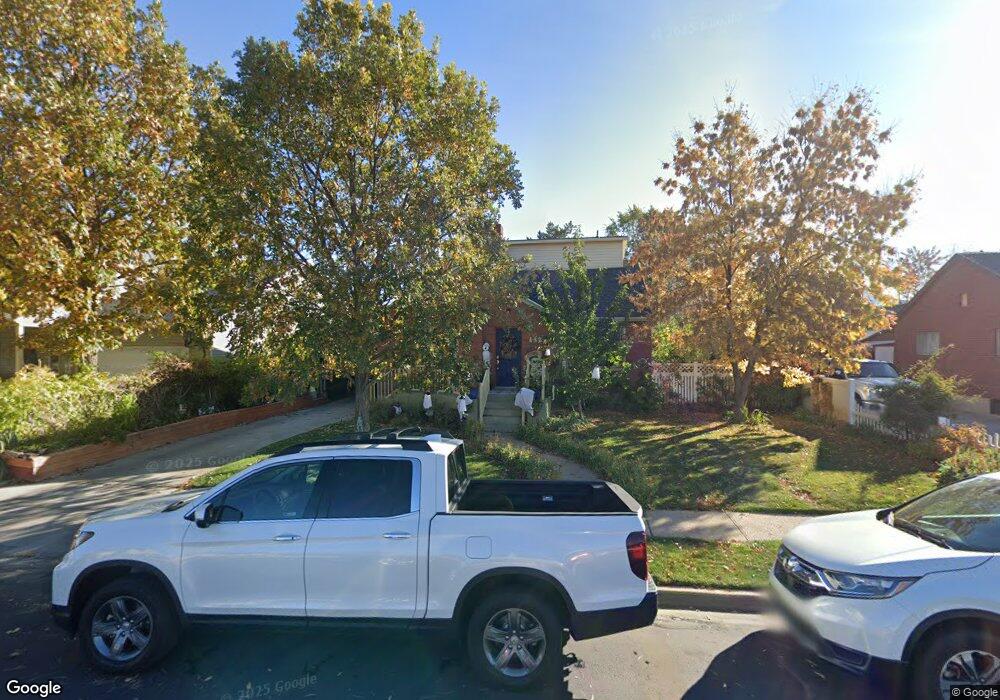
482 N 100 W Spanish Fork, UT 84660
Estimated Value: $462,000 - $530,000
4
Beds
3
Baths
2,722
Sq Ft
$184/Sq Ft
Est. Value
About This Home
This home is located at 482 N 100 W, Spanish Fork, UT 84660 and is currently estimated at $500,078, approximately $183 per square foot. 482 N 100 W is a home located in Utah County with nearby schools including Brockbank Elementary School, Spanish Fork Jr High School, and Spanish Fork High School.
Ownership History
Date
Name
Owned For
Owner Type
Purchase Details
Closed on
Jul 31, 2024
Sold by
Bowen Douglas G and Bowen Jarleen O
Bought by
Kingston Clarendon K and Price William Robert
Current Estimated Value
Home Financials for this Owner
Home Financials are based on the most recent Mortgage that was taken out on this home.
Original Mortgage
$465,414
Outstanding Balance
$460,519
Interest Rate
7.25%
Mortgage Type
FHA
Estimated Equity
$39,559
Purchase Details
Closed on
Oct 14, 1997
Sold by
Crook Ronald and Crook Angie
Bought by
Whiting Wallace D and Whiting Ethel J
Home Financials for this Owner
Home Financials are based on the most recent Mortgage that was taken out on this home.
Original Mortgage
$97,002
Interest Rate
8.5%
Create a Home Valuation Report for This Property
The Home Valuation Report is an in-depth analysis detailing your home's value as well as a comparison with similar homes in the area
Home Values in the Area
Average Home Value in this Area
Purchase History
| Date | Buyer | Sale Price | Title Company |
|---|---|---|---|
| Kingston Clarendon K | -- | Key Land Title | |
| Whiting Wallace D | -- | First American Title |
Source: Public Records
Mortgage History
| Date | Status | Borrower | Loan Amount |
|---|---|---|---|
| Open | Kingston Clarendon K | $465,414 | |
| Closed | Kingston Clarendon K | $24,000 | |
| Previous Owner | Whiting Wallace D | $97,002 |
Source: Public Records
Tax History Compared to Growth
Tax History
| Year | Tax Paid | Tax Assessment Tax Assessment Total Assessment is a certain percentage of the fair market value that is determined by local assessors to be the total taxable value of land and additions on the property. | Land | Improvement |
|---|---|---|---|---|
| 2025 | $2,090 | $243,540 | $136,300 | $306,500 |
| 2024 | $2,090 | $215,380 | $0 | $0 |
| 2023 | $2,070 | $213,620 | $0 | $0 |
| 2022 | $2,254 | $228,085 | $0 | $0 |
| 2021 | $2,014 | $326,000 | $79,100 | $246,900 |
| 2020 | $1,832 | $288,300 | $65,900 | $222,400 |
| 2019 | $1,566 | $259,300 | $65,900 | $193,400 |
| 2018 | $1,462 | $234,100 | $65,900 | $168,200 |
| 2017 | $1,328 | $114,290 | $0 | $0 |
| 2016 | $1,110 | $94,215 | $0 | $0 |
| 2015 | $1,104 | $92,620 | $0 | $0 |
| 2014 | $1,041 | $87,615 | $0 | $0 |
Source: Public Records
Map
Nearby Homes