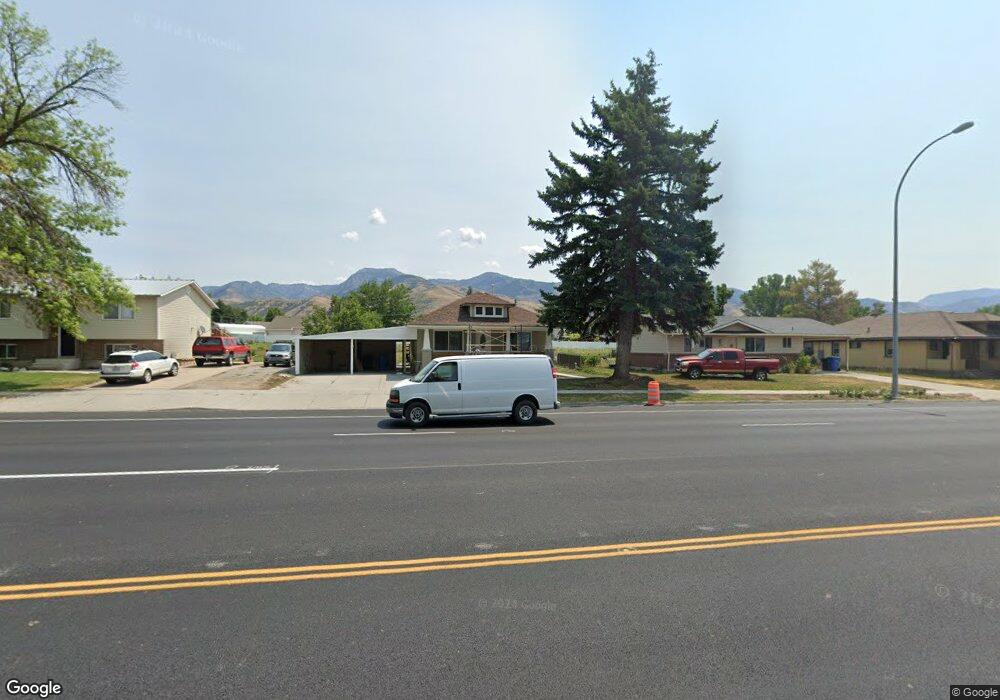
482 N Main St Smithfield, UT 84335
Estimated Value: $317,728 - $366,000
Studio
--
Bath
952
Sq Ft
$362/Sq Ft
Est. Value
About This Home
This home is located at 482 N Main St, Smithfield, UT 84335 and is currently estimated at $344,182, approximately $361 per square foot. 482 N Main St is a home with nearby schools including Birch Creek School, North Cache Middle School, and White Pine Middle School.
Ownership History
Date
Name
Owned For
Owner Type
Purchase Details
Closed on
May 6, 2025
Sold by
Nixon & Nixon Inc
Bought by
Nixon E J
Current Estimated Value
Purchase Details
Closed on
Jan 20, 2024
Sold by
Macdonald Taylor O and Macdonald Kathy S
Bought by
Nixon & Nixon Inc
Purchase Details
Closed on
Mar 28, 2005
Sold by
Nixon E J
Bought by
Macdonald Taylor O and Macdonald Kathy S
Home Financials for this Owner
Home Financials are based on the most recent Mortgage that was taken out on this home.
Original Mortgage
$62,996
Interest Rate
5.6%
Mortgage Type
Seller Take Back
Create a Home Valuation Report for This Property
The Home Valuation Report is an in-depth analysis detailing your home's value as well as a comparison with similar homes in the area
Home Values in the Area
Average Home Value in this Area
Purchase History
We collect this data history from publicly available records. To have your information removed, we recommend requesting removal directly through your county’s website.
| Date | Buyer | Sale Price | Title Company |
|---|---|---|---|
| Nixon E J | -- | None Listed On Document | |
| Nixon & Nixon Inc | -- | None Listed On Document | |
| Macdonald Taylor O | -- | Northern Title Company |
Source: Public Records
Mortgage History
We collect this data history from publicly available records. To have your information removed, we recommend requesting removal directly through your county’s website.
| Date | Status | Borrower | Loan Amount |
|---|---|---|---|
| Previous Owner | Macdonald Taylor O | $62,996 |
Source: Public Records
Tax History
| Year | Tax Paid | Tax Assessment Tax Assessment Total Assessment is a certain percentage of the fair market value that is determined by local assessors to be the total taxable value of land and additions on the property. | Land | Improvement |
|---|---|---|---|---|
| 2025 | $1,411 | $188,855 | $0 | $0 |
| 2024 | $1,458 | $183,070 | $0 | $0 |
| 2023 | $1,540 | $182,890 | $0 | $0 |
| 2022 | $126 | $147,570 | $0 | $0 |
| 2021 | $1,187 | $211,940 | $71,000 | $140,940 |
| 2020 | $1,077 | $179,416 | $71,000 | $108,416 |
| 2019 | $997 | $158,269 | $49,853 | $108,416 |
| 2018 | $955 | $146,653 | $49,853 | $96,800 |
| 2017 | $895 | $75,050 | $0 | $0 |
| 2016 | $911 | $75,050 | $0 | $0 |
| 2015 | $914 | $75,050 | $0 | $0 |
| 2014 | $881 | $73,730 | $0 | $0 |
| 2013 | $836 | $73,730 | $0 | $0 |
Source: Public Records
Map
Nearby Homes
Your Personal Tour Guide
Ask me questions while you tour the home.