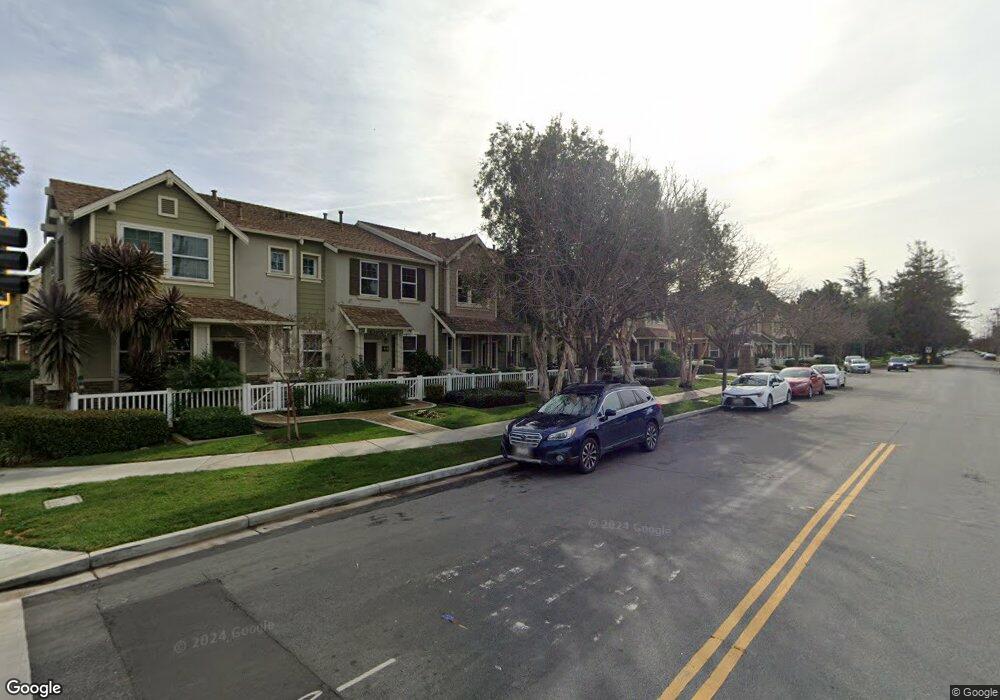
482 Rock Ave Fremont, CA 94536
Niles NeighborhoodEstimated Value: $837,000 - $1,020,000
About This Home
This home is located at 482 Rock Ave, Fremont, CA 94536 and is currently estimated at $950,925, approximately $723 per square foot. 482 Rock Ave is a home located in Alameda County with nearby schools including Niles Elementary School, Centerville Junior High School, and Washington High School.
Ownership History
We collect this data history from publicly available records. To have your information removed, we recommend requesting removal directly through your county’s website.
Purchase Details
Home Financials for this Owner
Home Financials are based on the most recent Mortgage that was taken out on this home.Home Values in the Area
Average Home Value in this Area
Purchase History
We collect this data history from publicly available records. To have your information removed, we recommend requesting removal directly through your county’s website.
| Date | Buyer | Sale Price | Title Company |
|---|---|---|---|
| $455,000 | First American Title Company |
Mortgage History
We collect this data history from publicly available records. To have your information removed, we recommend requesting removal directly through your county’s website.
| Date | Status | Borrower | Loan Amount |
|---|---|---|---|
| Open | $350,000 |
Tax History
We collect this data history from publicly available records. To have your information removed, we recommend requesting removal directly through your county’s website.
| Year | Tax Paid | Tax Assessment Tax Assessment Total Assessment is a certain percentage of the fair market value that is determined by local assessors to be the total taxable value of land and additions on the property. | Land | Improvement |
|---|---|---|---|---|
| 2025 | $7,176 | $578,888 | $175,766 | $410,122 |
| 2024 | $7,176 | $567,404 | $172,321 | $402,083 |
| 2023 | $6,979 | $563,144 | $168,943 | $394,201 |
| 2022 | $6,882 | $545,105 | $165,631 | $386,474 |
| 2021 | $6,720 | $534,281 | $162,384 | $378,897 |
| 2020 | $6,706 | $535,734 | $160,720 | $375,014 |
| 2019 | $6,630 | $525,233 | $157,570 | $367,663 |
| 2018 | $6,499 | $514,937 | $154,481 | $360,456 |
| 2017 | $6,336 | $504,840 | $151,452 | $353,388 |
| 2016 | $6,224 | $494,944 | $148,483 | $346,461 |
| 2015 | $6,134 | $487,514 | $146,254 | $341,260 |
| 2014 | $6,033 | $477,967 | $143,390 | $334,577 |
Map
- 439 Niles Common
- 295 Hirsch Terrace
- 310 Grau Dr
- 36341 Mission Blvd
- 374 Serramonte Terrace
- 290 Hillview Dr
- 330 Hillview Dr
- 263 Sandstone Dr
- 524 Hillview Dr
- 395 Sandstone Dr
- 37286 3rd St
- 34777 Klondike Ct
- 105 Chesapeake Dr
- 34761 Klondike Dr
- 34341 Sandburg Dr
- 165 Aurora Plaza
- 35520 Monterra Terrace Unit 302
- 35510 Monterra Terrace Unit 201
- 35509 Monterra Terrace Unit 201
- 35530 Monterra Terrace Unit 303
- 466 Rock Ave
- 450 Rock Ave
- 434 Rock Ave
- 502 Rock Ave
- 418 Rock Ave
- 36108 Rock Common
- 452 Boulder Terrace
- 518 Rock Ave
- 436 Boulder Terrace
- 402 Rock Ave
- 534 Rock Ave
- 420 Boulder Terrace
- 36119 Rock Common
- 404 Boulder Terrace
- 550 Rock Ave
- 530 Boulder Terrace
- 435 Rock Ave
- 36124 Rock Common
- 546 Boulder Terrace
- 566 Rock Ave
Ask me questions while you tour the home.