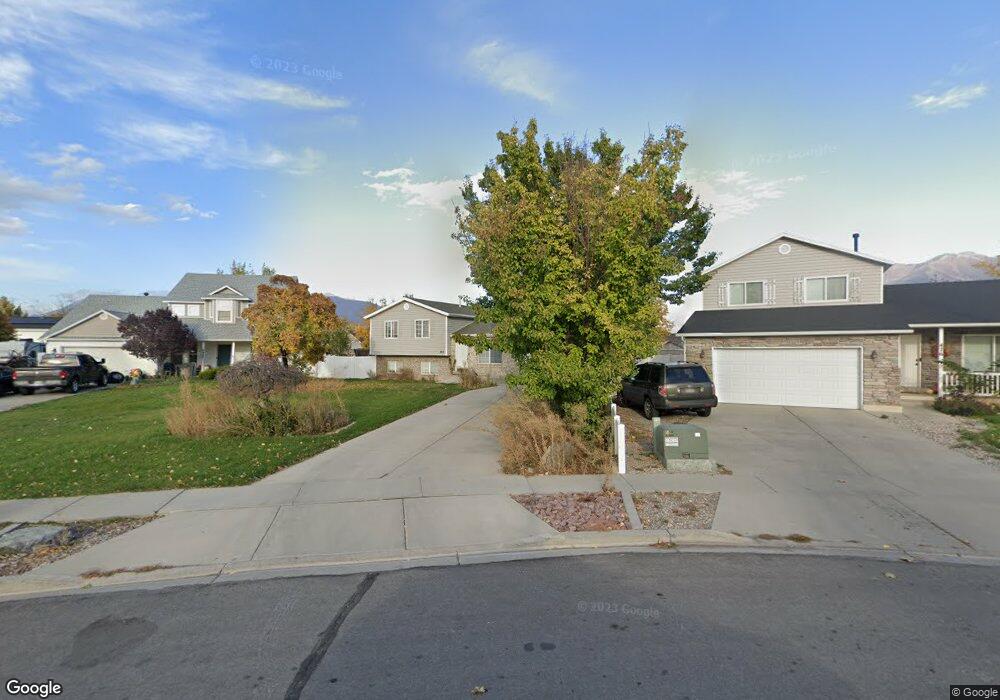
482 W 465 S Spanish Fork, UT 84660
Estimated Value: $462,000 - $496,000
4
Beds
3
Baths
2,050
Sq Ft
$235/Sq Ft
Est. Value
About This Home
This home is located at 482 W 465 S, Spanish Fork, UT 84660 and is currently estimated at $481,633, approximately $234 per square foot. 482 W 465 S is a home located in Utah County with nearby schools including Riverview Elementary School, Spanish Fork Jr High School, and Spanish Fork High School.
Ownership History
Date
Name
Owned For
Owner Type
Purchase Details
Closed on
Sep 22, 2015
Sold by
American Homes 4 Rent Properties Three L
Bought by
Amh 2015 2 Borrower Llc
Current Estimated Value
Purchase Details
Closed on
Feb 27, 2013
Sold by
Holman Layne B and Holman Laura M
Bought by
American Homes 4 Rent Properties Three L
Purchase Details
Closed on
Jul 18, 2001
Sold by
Salisbury Development Lc
Bought by
Holman Layne B and Holman Laura M
Home Financials for this Owner
Home Financials are based on the most recent Mortgage that was taken out on this home.
Original Mortgage
$129,174
Interest Rate
7.21%
Mortgage Type
FHA
Create a Home Valuation Report for This Property
The Home Valuation Report is an in-depth analysis detailing your home's value as well as a comparison with similar homes in the area
Home Values in the Area
Average Home Value in this Area
Purchase History
| Date | Buyer | Sale Price | Title Company |
|---|---|---|---|
| Amh 2015 2 Borrower Llc | -- | None Available | |
| American Homes 4 Rent Properties Three L | -- | United West Title | |
| American Homes 4 Rent Properties Three L | -- | United West Title | |
| Holman Layne B | -- | Provo Land Title Company |
Source: Public Records
Mortgage History
| Date | Status | Borrower | Loan Amount |
|---|---|---|---|
| Previous Owner | Holman Layne B | $129,174 |
Source: Public Records
Tax History Compared to Growth
Tax History
| Year | Tax Paid | Tax Assessment Tax Assessment Total Assessment is a certain percentage of the fair market value that is determined by local assessors to be the total taxable value of land and additions on the property. | Land | Improvement |
|---|---|---|---|---|
| 2025 | $2,160 | $249,315 | $177,200 | $276,100 |
| 2024 | $2,160 | $222,640 | $0 | $0 |
| 2023 | $2,187 | $225,665 | $0 | $0 |
| 2022 | $2,242 | $226,875 | $0 | $0 |
| 2021 | $1,872 | $303,100 | $105,900 | $197,200 |
| 2020 | $1,783 | $280,600 | $96,300 | $184,300 |
| 2019 | $1,643 | $272,100 | $87,800 | $184,300 |
| 2018 | $1,530 | $244,900 | $80,800 | $164,100 |
| 2017 | $1,374 | $118,250 | $0 | $0 |
| 2016 | $1,301 | $110,495 | $0 | $0 |
| 2015 | $1,185 | $99,440 | $0 | $0 |
| 2014 | $1,111 | $93,555 | $0 | $0 |
Source: Public Records
Map
Nearby Homes
- 351 W 530 S
- 2645 W 360 S Unit 1
- 2576 W 360 S Unit 5
- 501 S 880 W
- 225 W 300 S
- 134 W 700 S
- 733 S 170 W
- 88 S 400 W
- 721 S 110 W
- 231 S 880 W
- 324 S St Unit 204
- 325 S St Unit 203
- 298 S St Unit 205
- 1701 Del Monte Rd Unit 21
- 984 S 550 W Unit 917
- 13 N 710 W
- 1076 River Hill Dr
- 103 E 400 S
- 787 W 1120 S
- 1040 W Center St