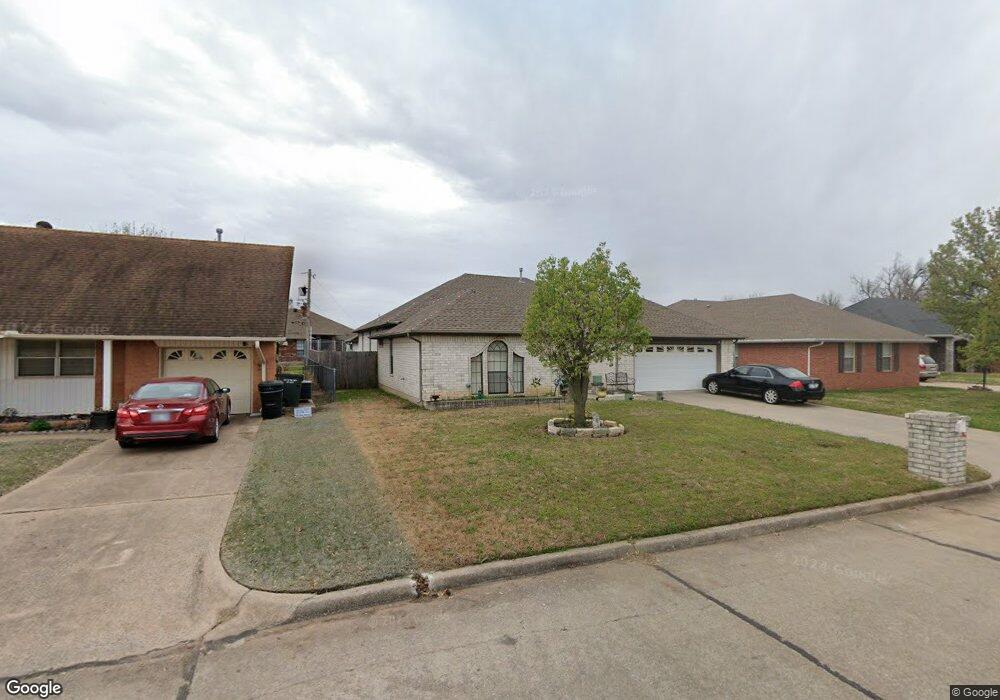
4820 Newport Dr Oklahoma City, OK 73115
Estimated Value: $243,783 - $262,000
3
Beds
2
Baths
2,369
Sq Ft
$108/Sq Ft
Est. Value
About This Home
This home is located at 4820 Newport Dr, Oklahoma City, OK 73115 and is currently estimated at $254,946, approximately $107 per square foot. 4820 Newport Dr is a home located in Oklahoma County with nearby schools including Townsend Elementary School, Kerr Middle School, and Del City High School.
Ownership History
Date
Name
Owned For
Owner Type
Purchase Details
Closed on
Jan 13, 2012
Sold by
Mcneely Ervin
Bought by
Mcneely Jacqueline D
Current Estimated Value
Purchase Details
Closed on
Sep 29, 2006
Sold by
Gragg Roger Keith
Bought by
Mcneely Ervin and Mcneely Jacqueline Childs
Home Financials for this Owner
Home Financials are based on the most recent Mortgage that was taken out on this home.
Original Mortgage
$159,000
Outstanding Balance
$94,774
Interest Rate
6.44%
Mortgage Type
Unknown
Estimated Equity
$160,172
Create a Home Valuation Report for This Property
The Home Valuation Report is an in-depth analysis detailing your home's value as well as a comparison with similar homes in the area
Home Values in the Area
Average Home Value in this Area
Purchase History
| Date | Buyer | Sale Price | Title Company |
|---|---|---|---|
| Mcneely Jacqueline D | -- | None Available | |
| Mcneely Ervin | $159,000 | Nations Title Of Okc |
Source: Public Records
Mortgage History
| Date | Status | Borrower | Loan Amount |
|---|---|---|---|
| Open | Mcneely Ervin | $159,000 |
Source: Public Records
Tax History Compared to Growth
Tax History
| Year | Tax Paid | Tax Assessment Tax Assessment Total Assessment is a certain percentage of the fair market value that is determined by local assessors to be the total taxable value of land and additions on the property. | Land | Improvement |
|---|---|---|---|---|
| 2024 | $2,233 | $21,479 | $1,791 | $19,688 |
| 2023 | $2,233 | $20,854 | $1,805 | $19,049 |
| 2022 | $2,132 | $20,246 | $2,063 | $18,183 |
| 2021 | $2,140 | $19,657 | $2,256 | $17,401 |
| 2020 | $2,130 | $19,085 | $2,306 | $16,779 |
| 2019 | $2,091 | $19,317 | $2,294 | $17,023 |
| 2018 | $2,056 | $18,755 | $0 | $0 |
| 2017 | $2,051 | $18,589 | $2,306 | $16,283 |
| 2016 | $2,089 | $18,424 | $2,393 | $16,031 |
| 2015 | $2,087 | $18,314 | $2,393 | $15,921 |
| 2014 | $2,053 | $18,074 | $2,353 | $15,721 |
Source: Public Records
Map
Nearby Homes
- 4809 Elmview Dr
- 4813 Elmview Dr
- 3128 Del View Dr
- 3413 Del View Dr
- 3500 Del View Dr
- 4853 Montclair Dr
- 4700 Elmview Dr
- 4704 Tempo Dr
- 4729 SE 27th St
- 4540 SE 35th St
- 4809 SE 41st St
- 4732 Princess Ln
- 4113 Vickie Dr
- 4625 SE 42nd St
- 4521 SE 27th St
- 4760 SE 23rd St
- 4601 SE 26th St
- 4736 SE 23rd St
- 4428 SE 38th St
- 4620 SE 24th St
- 4824 Newport Dr
- 4816 Newport Dr
- 4849 Del Aire Dr
- 4828 Newport Dr
- 4812 Newport Dr
- 4845 Del Aire Dr
- 4853 Del Aire Dr
- 4821 Newport Dr
- 4817 Newport Dr
- 4841 Del Aire Dr
- 4825 Newport Dr
- 4832 Newport Dr
- 4808 Newport Dr
- 4813 Newport Dr
- 4857 Del Aire Dr
- 4829 Newport Dr
- 4809 Newport Dr
- 4836 Newport Dr
- 4833 Newport Dr
- 4837 Del Aire Dr