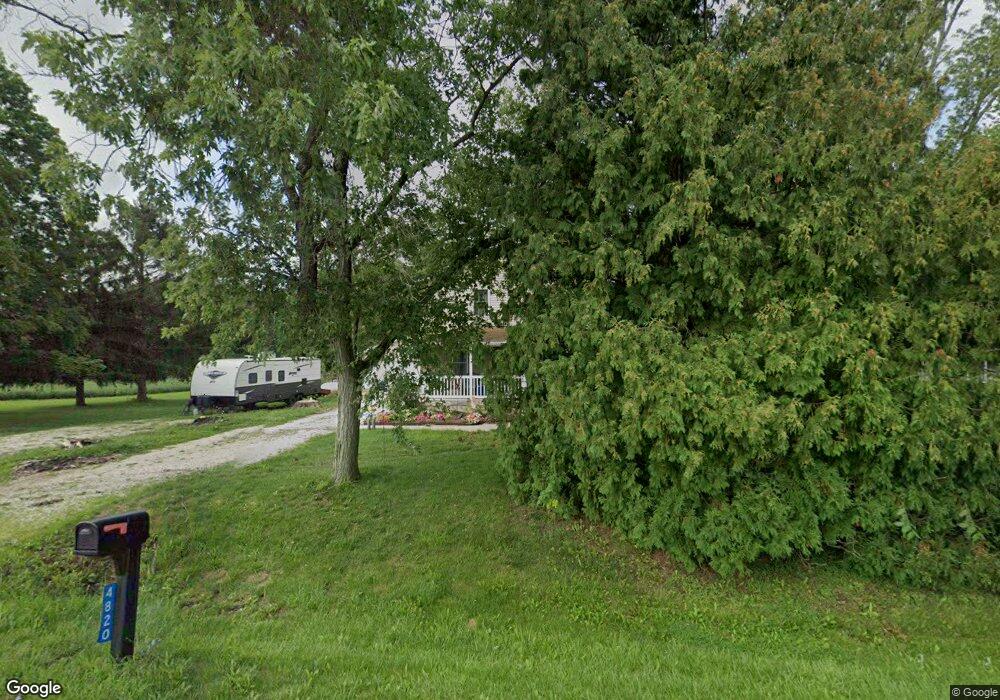
4820 W Cedar Hills Dr Dunlap, IL 61525
Estimated Value: $126,000 - $160,212
3
Beds
2
Baths
1,390
Sq Ft
$102/Sq Ft
Est. Value
About This Home
This home is located at 4820 W Cedar Hills Dr, Dunlap, IL 61525 and is currently estimated at $141,553, approximately $101 per square foot. 4820 W Cedar Hills Dr is a home located in Peoria County with nearby schools including Dunlap Grade School, Dunlap Valley Middle School, and Dunlap High School.
Create a Home Valuation Report for This Property
The Home Valuation Report is an in-depth analysis detailing your home's value as well as a comparison with similar homes in the area
Home Values in the Area
Average Home Value in this Area
Tax History Compared to Growth
Tax History
| Year | Tax Paid | Tax Assessment Tax Assessment Total Assessment is a certain percentage of the fair market value that is determined by local assessors to be the total taxable value of land and additions on the property. | Land | Improvement |
|---|---|---|---|---|
| 2024 | $2,290 | $37,890 | $8,270 | $29,620 |
| 2023 | $2,146 | $35,740 | $7,800 | $27,940 |
| 2022 | $1,960 | $32,920 | $7,150 | $25,770 |
| 2021 | $1,866 | $31,350 | $6,810 | $24,540 |
| 2020 | $1,817 | $30,440 | $6,610 | $23,830 |
| 2019 | $1,762 | $31,060 | $6,740 | $24,320 |
| 2018 | $1,783 | $31,650 | $6,870 | $24,780 |
| 2017 | $1,895 | $32,970 | $7,160 | $25,810 |
| 2016 | $1,821 | $32,970 | $7,160 | $25,810 |
| 2015 | $1,819 | $31,700 | $6,880 | $24,820 |
| 2014 | $1,780 | $32,180 | $6,990 | $25,190 |
| 2013 | -- | $31,550 | $6,850 | $24,700 |
Source: Public Records
Map
Nearby Homes
- 312 S 4th St
- Lot 136 French Dr
- 427 W Westfield Ct
- 311 N 2nd St
- LOT 209 Copperpoint Dr
- LOT 208 Copperpoint Dr
- LOT 212 Copperpoint Dr
- 408 N 3rd St
- 504 N 4th St
- LOT 204 W Salem School Ct
- 5821 W Dickison Cemetery Rd
- 11801 N Deerfield Dr
- 11417 N Route 91 Rd
- 11518 N Nettle Creek Dr
- 11428 N Boulder Creek Ct
- 11227 N Stone Creek Dr
- 11310 N Copper Creek Point
- 2203 W Augusta Dr
- Lot 7 W Augusta Dr
- 2218 W Augusta Dr
- 4908 W Cedar Hills Dr
- 4809 W Cedar Hills Dr
- 5002 W Cedar Hills Dr
- LOT Parkview Point
- 4619 W Cedar Hills Dr
- 4615 W Cedar Hills Dr
- 4601 W Cedar Hills Dr
- Lot 3 W Cedar Hills Dr
- Lot 2 W Cedar Hills Dr
- Lot 1 W Cedar Hills Dr
- 0 W Cedar Hills Dr
- 4500 W Cedar Hills Dr
- 4500 W Cedar Hills Dr Unit 2
- 4515 W Cedar Hills Dr
- 4506 W Cedar Hills Dr
- 5206 W Cedar Hills Dr
- 4510 W Cedar Hills Dr
- 4425 W Simpson Dr
- 13400 N Lakewood Dr
- 13403 N Lakewood Dr