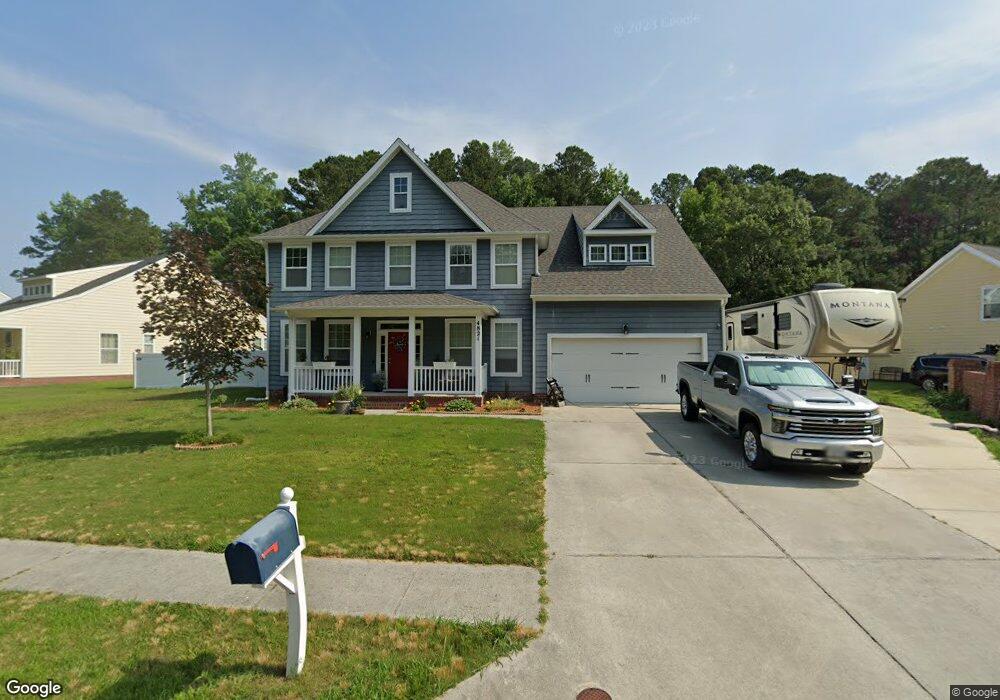
4821 Lake Shore Dr Chesapeake, VA 23321
Western Branch NeighborhoodEstimated Value: $559,753
5
Beds
4
Baths
2,950
Sq Ft
$190/Sq Ft
Est. Value
About This Home
This home is located at 4821 Lake Shore Dr, Chesapeake, VA 23321 and is currently priced at $559,753, approximately $189 per square foot. 4821 Lake Shore Dr is a home located in Chesapeake City with nearby schools including Edwin W. Chittum Elementary School, Jolliff Middle School, and Western Branch High School.
Ownership History
Date
Name
Owned For
Owner Type
Purchase Details
Closed on
Jul 27, 2020
Sold by
Ziaja Rebecca A
Bought by
Torbert Tyler L and Torbert Kathryn L
Current Estimated Value
Home Financials for this Owner
Home Financials are based on the most recent Mortgage that was taken out on this home.
Original Mortgage
$424,760
Outstanding Balance
$377,488
Interest Rate
3.1%
Mortgage Type
VA
Purchase Details
Closed on
Mar 26, 2019
Sold by
Ziaja Theodore Edward and Ziaja Rebecca A
Bought by
Ziaja Rebecca A
Purchase Details
Closed on
Sep 3, 2014
Sold by
Hearndon Jolliff Builders Llc
Bought by
Ziaja Theodore E
Home Financials for this Owner
Home Financials are based on the most recent Mortgage that was taken out on this home.
Original Mortgage
$353,655
Interest Rate
4.12%
Mortgage Type
VA
Create a Home Valuation Report for This Property
The Home Valuation Report is an in-depth analysis detailing your home's value as well as a comparison with similar homes in the area
Home Values in the Area
Average Home Value in this Area
Purchase History
| Date | Buyer | Sale Price | Title Company |
|---|---|---|---|
| Torbert Tyler L | $410,000 | Title Concepts Llc | |
| Ziaja Rebecca A | -- | None Available | |
| Ziaja Theodore E | $353,655 | -- |
Source: Public Records
Mortgage History
| Date | Status | Borrower | Loan Amount |
|---|---|---|---|
| Open | Torbert Tyler L | $424,760 | |
| Previous Owner | Ziaja Theodore E | $353,655 |
Source: Public Records
Tax History Compared to Growth
Tax History
| Year | Tax Paid | Tax Assessment Tax Assessment Total Assessment is a certain percentage of the fair market value that is determined by local assessors to be the total taxable value of land and additions on the property. | Land | Improvement |
|---|---|---|---|---|
| 2025 | $5,136 | $579,700 | $160,000 | $419,700 |
| 2024 | $5,136 | $552,200 | $150,000 | $402,200 |
| 2023 | $5,136 | $508,500 | $140,000 | $368,500 |
| 2022 | $5,046 | $499,600 | $135,000 | $364,600 |
| 2021 | $4,212 | $401,100 | $115,000 | $286,100 |
| 2020 | $3,067 | $389,500 | $110,000 | $279,500 |
| 2019 | $3,977 | $378,800 | $110,000 | $268,800 |
| 2018 | $3,977 | $346,400 | $100,000 | $246,400 |
| 2017 | $3,849 | $366,600 | $100,000 | $266,600 |
| 2016 | $3,637 | $346,400 | $100,000 | $246,400 |
| 2015 | $3,484 | $331,800 | $90,000 | $241,800 |
| 2014 | $945 | $90,000 | $90,000 | $0 |
Source: Public Records
Map
Nearby Homes
- 4906 Lake Shore Dr
- 5208 Askew Rd
- 5533 Willow Lake Rd
- 5105 Lake Shore Ct
- 4817 Charlton Dr
- 1532 Jolliff Rd
- 1530 Jolliff Rd
- 1248 Jolliff Rd
- 1604 Tapgallant Quay
- 4930 Breck Ln
- 4920 Breck Ln
- 4912 Breck Ln
- 4910 Breck Ln
- 4921 Apricot Way
- 4917 Apricot Way
- 4915 Apricot Way
- 4911 Apricot Way
- 4909 Apricot Way
- 4905 Apricot Way
- 4903 Apricot Way
- 4825 Lake Shore Dr
- 4817 Lake Shore Dr
- 4813 Lake Shore Dr
- 4818 Lake Shore Dr
- 4820 Lake Shore Dr
- 4816 Lake Shore Dr
- 4900 Lake Shore Dr
- 4809 Lake Shore Dr
- 4905 Lake Shore Dr
- 4904 Lake Shore Dr
- 4909 Lake Shore Dr
- 4808 Lake Shore Dr
- 4805 Lake Shore Dr
- 5440 Royal Tern Ct
- 5432 Royal Tern Ct
- 5436 Royal Tern Ct
- 4912 Lake Shore Dr
- 4804 Lake Shore Dr
- 4801 Lake Shore Dr
- 5428 Royal Tern Ct