Endeavour Condominium 4821 Nasa Pkwy Unit 4SW Seabrook, TX 77586
Estimated Value: $289,815 - $379,000
2
Beds
2
Baths
1,278
Sq Ft
$272/Sq Ft
Est. Value
About This Home
This home is located at 4821 Nasa Pkwy Unit 4SW, Seabrook, TX 77586 and is currently estimated at $347,454, approximately $271 per square foot. 4821 Nasa Pkwy Unit 4SW is a home located in Harris County with nearby schools including G.W. Robinson Elementary, Seabrook Intermediate School, and Clear Lake High School.
Ownership History
Date
Name
Owned For
Owner Type
Purchase Details
Closed on
Feb 29, 2012
Sold by
Dnommah Llc
Bought by
Texas Dnommah Lp
Current Estimated Value
Purchase Details
Closed on
Feb 6, 2012
Sold by
Fannie Mae
Bought by
Bank Of America Na
Purchase Details
Closed on
Aug 27, 2010
Sold by
Federal National Mortgage Association
Bought by
Dnommah Llc
Purchase Details
Closed on
Apr 6, 2010
Sold by
Valdehueza Cesar and Valdehueza Jacqueline
Bought by
Federal National Mortgage Association
Purchase Details
Closed on
Feb 14, 2008
Sold by
Endeavour Highrise Lp
Bought by
Valdehueza Cesar and Valdehueza Jacqueline
Home Financials for this Owner
Home Financials are based on the most recent Mortgage that was taken out on this home.
Original Mortgage
$414,405
Interest Rate
5.88%
Mortgage Type
Purchase Money Mortgage
Create a Home Valuation Report for This Property
The Home Valuation Report is an in-depth analysis detailing your home's value as well as a comparison with similar homes in the area
Home Values in the Area
Average Home Value in this Area
Purchase History
| Date | Buyer | Sale Price | Title Company |
|---|---|---|---|
| Texas Dnommah Lp | -- | Multiple | |
| Bank Of America Na | -- | First American | |
| Dnommah Llc | $20,000 | None Available | |
| Federal National Mortgage Association | $383,588 | None Available | |
| Valdehueza Cesar | -- | None Available |
Source: Public Records
Mortgage History
| Date | Status | Borrower | Loan Amount |
|---|---|---|---|
| Previous Owner | Valdehueza Cesar | $414,405 |
Source: Public Records
Tax History Compared to Growth
Tax History
| Year | Tax Paid | Tax Assessment Tax Assessment Total Assessment is a certain percentage of the fair market value that is determined by local assessors to be the total taxable value of land and additions on the property. | Land | Improvement |
|---|---|---|---|---|
| 2025 | $7,276 | $310,000 | $58,900 | $251,100 |
| 2024 | $7,276 | $316,000 | $60,040 | $255,960 |
| 2023 | $7,276 | $323,920 | $61,545 | $262,375 |
| 2022 | $6,428 | $267,000 | $53,333 | $213,667 |
| 2021 | $6,787 | $267,000 | $53,333 | $213,667 |
| 2020 | $7,767 | $280,707 | $53,334 | $227,373 |
| 2019 | $7,302 | $268,100 | $50,939 | $217,161 |
| 2018 | $3,127 | $250,000 | $47,500 | $202,500 |
| 2017 | $7,201 | $250,000 | $47,500 | $202,500 |
| 2016 | $7,674 | $266,398 | $50,616 | $215,782 |
| 2015 | $7,071 | $264,902 | $50,331 | $214,571 |
| 2014 | $7,071 | $244,421 | $46,440 | $197,981 |
Source: Public Records
About Endeavour Condominium
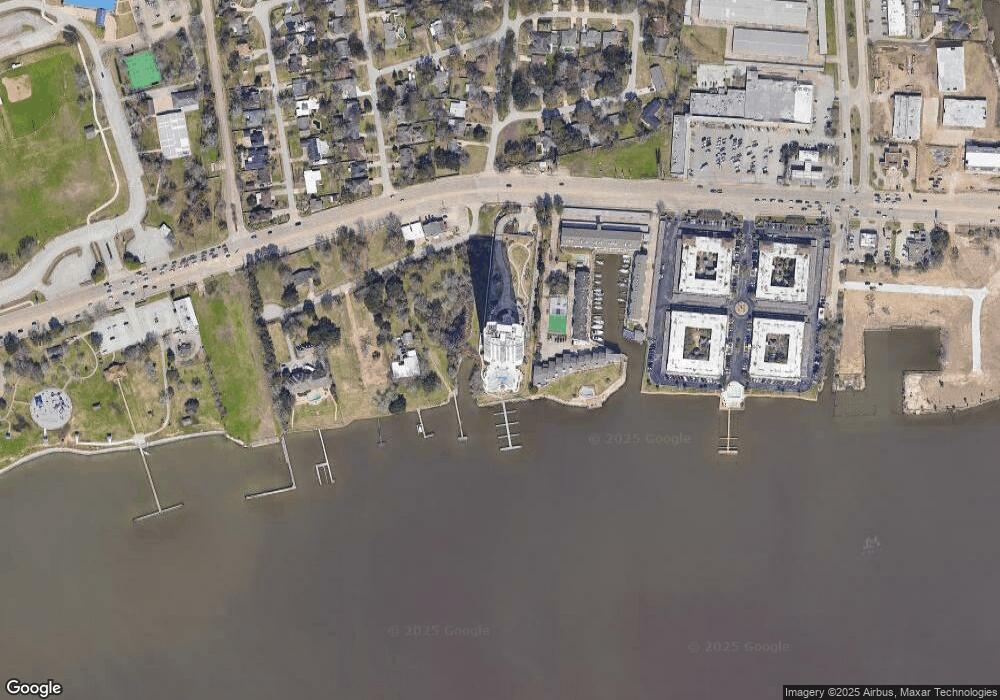
Map
Nearby Homes
- 4821 Nasa Parkway 19w Pkwy E Unit 19 W
- 4821 Nasa Pkwy Unit 21W
- 4821 Nasa Pkwy Unit 20E
- 2 Mariner Village Dr
- 16 Mariner Village Dr
- 105 Mockingbird Ln
- 4747 Nasa Pkwy Unit 102
- 4747 Nasa Pkwy Unit 104
- 4747 Nasa Pkwy Unit 206
- 4747 Nasa Pkwy Unit 110
- 4747 E Nasa Pkwy
- 502 Wildwood Dr
- 119 Kirby Rd Unit 5202
- 119 Kirby Rd Unit 5302
- 4408 Anthony Court Ln
- 4406 Anthony Court Ln
- 4417 Anthony Court Ln
- 4415 Anthony Court Ln
- 4413 Anthony Court Ln
- 4411 Anthony Court Ln
- 4821 Nasa Pkwy Unit 22W
- 4821 Nasa Pkwy Unit P2
- 4821 Nasa Pkwy Unit P3
- 4821 Nasa Pkwy Unit 4P
- 4821 Nasa Pkwy Unit 26E
- 4821 Nasa Pkwy Unit 9SW
- 4821 Nasa Pkwy Unit 12SW
- 4821 Nasa Pkwy Unit 8SE
- 4821 Nasa Pkwy Unit 10W
- 4821 Nasa Pkwy Unit 11SE
- 4821 Nasa Pkwy Unit 11E
- 4821 Nasa Pkwy Unit 6SW
- 4821 Nasa Pkwy Unit 18E
- 4821 Nasa Pkwy Unit 8SW
- 4821 Nasa Pkwy Unit 12SE
- 4821 Nasa Pkwy Unit 11SW
- 4821 Nasa Pkwy Unit 24S
- 4821 Nasa Pkwy Unit 9SE
- 4821 Nasa Pkwy Unit 4SE
- 4821 Nasa Pkwy Unit 5SE