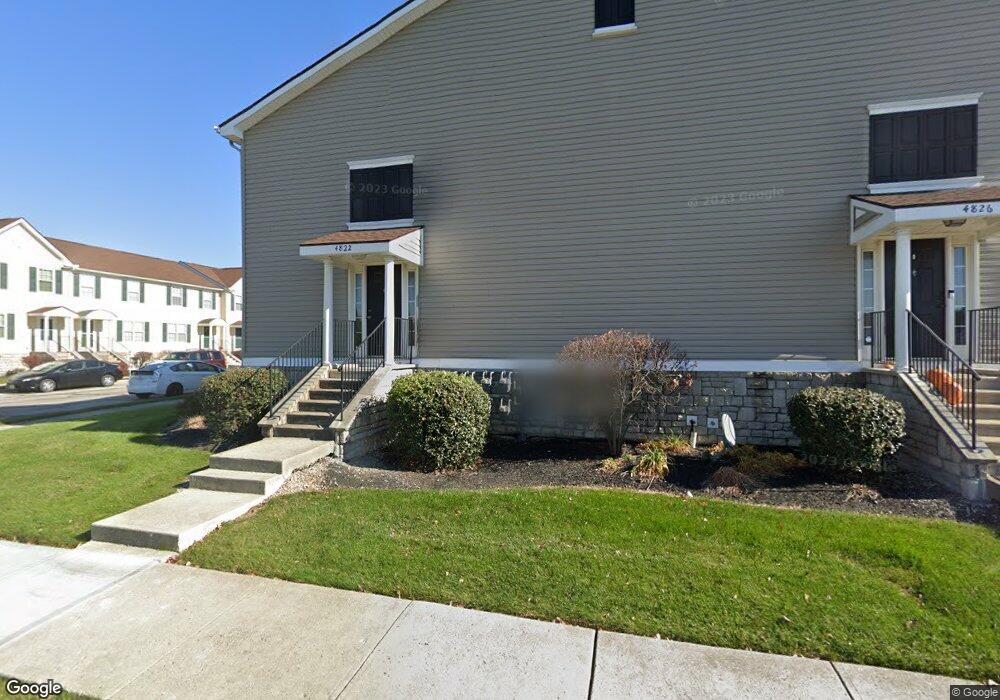
4822 Red Alder Dr Unit 64822 Canal Winchester, OH 43110
East Columbus-White Ash NeighborhoodEstimated Value: $150,000 - $162,060
1
Bed
2
Baths
1,088
Sq Ft
$143/Sq Ft
Est. Value
About This Home
This home is located at 4822 Red Alder Dr Unit 64822, Canal Winchester, OH 43110 and is currently estimated at $155,515, approximately $142 per square foot. 4822 Red Alder Dr Unit 64822 is a home located in Franklin County with nearby schools including Liberty Elementary School, Yorktown Middle School, and Independence High School.
Ownership History
Date
Name
Owned For
Owner Type
Purchase Details
Closed on
Nov 26, 2024
Sold by
Allen Michael C
Bought by
Johnson Alexis
Current Estimated Value
Home Financials for this Owner
Home Financials are based on the most recent Mortgage that was taken out on this home.
Original Mortgage
$146,955
Outstanding Balance
$145,799
Interest Rate
6.79%
Mortgage Type
New Conventional
Estimated Equity
$9,716
Purchase Details
Closed on
Jan 14, 2017
Sold by
Blankenship Kyle A
Bought by
Allen Michael C
Purchase Details
Closed on
Jun 30, 2008
Sold by
Artrip Chad W
Bought by
Blankenship Kyle A
Home Financials for this Owner
Home Financials are based on the most recent Mortgage that was taken out on this home.
Original Mortgage
$64,452
Interest Rate
6.1%
Mortgage Type
FHA
Purchase Details
Closed on
Jan 6, 2005
Sold by
White Oak Park Ltd
Bought by
Artrip Chad W
Home Financials for this Owner
Home Financials are based on the most recent Mortgage that was taken out on this home.
Original Mortgage
$78,900
Interest Rate
5.7%
Mortgage Type
FHA
Create a Home Valuation Report for This Property
The Home Valuation Report is an in-depth analysis detailing your home's value as well as a comparison with similar homes in the area
Home Values in the Area
Average Home Value in this Area
Purchase History
| Date | Buyer | Sale Price | Title Company |
|---|---|---|---|
| Johnson Alexis | $151,500 | Valmer Land Title | |
| Allen Michael C | $50,000 | Valmer Land Title Agency | |
| Blankenship Kyle A | $65,000 | Chicago Tit | |
| Artrip Chad W | $80,800 | Connor Land |
Source: Public Records
Mortgage History
| Date | Status | Borrower | Loan Amount |
|---|---|---|---|
| Open | Johnson Alexis | $146,955 | |
| Previous Owner | Blankenship Kyle A | $64,452 | |
| Previous Owner | Artrip Chad W | $78,900 |
Source: Public Records
Tax History Compared to Growth
Tax History
| Year | Tax Paid | Tax Assessment Tax Assessment Total Assessment is a certain percentage of the fair market value that is determined by local assessors to be the total taxable value of land and additions on the property. | Land | Improvement |
|---|---|---|---|---|
| 2024 | $2,095 | $45,710 | $12,250 | $33,460 |
| 2023 | $2,069 | $45,710 | $12,250 | $33,460 |
| 2022 | $1,107 | $20,830 | $3,330 | $17,500 |
| 2021 | $1,109 | $20,830 | $3,330 | $17,500 |
| 2020 | $1,111 | $20,830 | $3,330 | $17,500 |
| 2019 | $1,382 | $19,810 | $3,150 | $16,660 |
| 2018 | $1,237 | $19,810 | $3,150 | $16,660 |
| 2017 | $1,203 | $19,810 | $3,150 | $16,660 |
| 2016 | $1,206 | $18,200 | $3,080 | $15,120 |
| 2015 | $1,094 | $18,200 | $3,080 | $15,120 |
| 2014 | $1,097 | $18,200 | $3,080 | $15,120 |
| 2013 | $676 | $22,750 | $3,850 | $18,900 |
Source: Public Records
Map
Nearby Homes
- 6479 Crab Apple Dr Unit 4
- 6409 Nottinghill Trail Dr Unit 26409
- 6514 Crab Apple Dr Unit 11
- 6395 Nottinghill Trail Dr Unit 1
- 6539 Nottinghill Trail Dr Unit 15
- 6389 Nottinghill Trail Dr Unit 1
- 6551 Crab Apple Dr Unit 17
- 4837 Ballentine Dr
- 6363 Chelsea Glen Dr
- Fairton Plan at Brookview
- Sienna Plan at Brookview
- Pendleton Plan at Brookview
- Bellamy Plan at Brookview
- Henley Plan at Brookview
- Harmony Plan at Brookview
- Chatham Plan at Brookview
- Juniper Plan at Brookview
- 5012 Gore St
- 6741 Axtel Dr Unit 11A
- 6689 Axtel Dr Unit 4D
- 6459 Nottinghill Trail Dr Unit 66459
- 4826 Red Alder Dr Unit 64826
- 6461 Nottinghill Trail Dr Unit 66461
- 6463 Nottinghill Trail Dr Unit 66463
- 6463 Nottinghill Trail Dr Unit 6
- 6465 Nottinghill Trail Dr Unit 66465
- 6469 Nottinghill Trail Dr Unit 66469
- 6467 Nottinghill Trail Dr Unit 66467
- 6471 Nottinghill Trail Dr Unit 66471
- 6473 Nottinghill Trail Dr Unit 66473
- 6462 Nottinghill Trail Dr Unit 56462
- 6460 Nottinghill Trail Dr Unit 56460
- 6464 Nottinghill Trail Dr Unit 56464
- 6466 Nottinghill Trail Dr Unit 56466
- 6468 Nottinghill Trail Dr Unit 56468
- 6470 Nottinghill Trail Dr Unit 56470
- 6470 Nottinghill Trail Dr Unit 5
- 6483 Nottinghill Trail Dr Unit 76483
- 6481 Nottinghill Trail Dr
- 4820 Annual Dr