4822 S 187th Place Unit C-102 Seatac, WA 98188
Estimated Value: $249,000 - $282,000
2
Beds
2
Baths
805
Sq Ft
$327/Sq Ft
Est. Value
About This Home
This home is located at 4822 S 187th Place Unit C-102, Seatac, WA 98188 and is currently estimated at $263,129, approximately $326 per square foot. 4822 S 187th Place Unit C-102 is a home located in King County with nearby schools including Bow Lake Elementary School, Chinook Middle School, and Tyee High School.
Ownership History
Date
Name
Owned For
Owner Type
Purchase Details
Closed on
Jul 20, 2016
Sold by
Couet Lyndsie R and Mates Lyndsie R
Bought by
Hagos Yordanos D
Current Estimated Value
Home Financials for this Owner
Home Financials are based on the most recent Mortgage that was taken out on this home.
Original Mortgage
$134,897
Outstanding Balance
$107,758
Interest Rate
3.6%
Estimated Equity
$155,371
Purchase Details
Closed on
May 27, 2008
Sold by
Vajtai Lew
Bought by
Mates Lyndsie R
Home Financials for this Owner
Home Financials are based on the most recent Mortgage that was taken out on this home.
Original Mortgage
$141,600
Interest Rate
5.87%
Purchase Details
Closed on
Sep 14, 1999
Sold by
Hubbell Laura M
Bought by
Vajtai Lew
Home Financials for this Owner
Home Financials are based on the most recent Mortgage that was taken out on this home.
Original Mortgage
$47,000
Interest Rate
7.89%
Create a Home Valuation Report for This Property
The Home Valuation Report is an in-depth analysis detailing your home's value as well as a comparison with similar homes in the area
Home Values in the Area
Average Home Value in this Area
Purchase History
| Date | Buyer | Sale Price | Title Company |
|---|---|---|---|
| Hagos Yordanos D | $145,050 | Wfg National | |
| Mates Lyndsie R | $146,000 | Chicago Title | |
| Vajtai Lew | $59,500 | Evergreen Title Company Inc |
Source: Public Records
Mortgage History
| Date | Status | Borrower | Loan Amount |
|---|---|---|---|
| Open | Hagos Yordanos D | $134,897 | |
| Previous Owner | Mates Lyndsie R | $141,600 | |
| Previous Owner | Vajtai Lew | $47,000 |
Source: Public Records
Tax History Compared to Growth
Tax History
| Year | Tax Paid | Tax Assessment Tax Assessment Total Assessment is a certain percentage of the fair market value that is determined by local assessors to be the total taxable value of land and additions on the property. | Land | Improvement |
|---|---|---|---|---|
| 2024 | $2,668 | $239,000 | $34,500 | $204,500 |
| 2023 | $2,322 | $242,000 | $33,600 | $208,400 |
| 2022 | $2,264 | $209,000 | $32,700 | $176,300 |
| 2021 | $2,106 | $179,000 | $28,100 | $150,900 |
| 2020 | $2,092 | $161,000 | $27,200 | $133,800 |
| 2018 | $1,808 | $139,000 | $14,500 | $124,500 |
| 2017 | $1,160 | $124,000 | $11,800 | $112,200 |
| 2016 | $966 | $79,000 | $11,800 | $67,200 |
| 2015 | $1,010 | $67,000 | $14,500 | $52,500 |
| 2014 | -- | $68,000 | $14,500 | $53,500 |
| 2013 | -- | $70,000 | $14,500 | $55,500 |
Source: Public Records
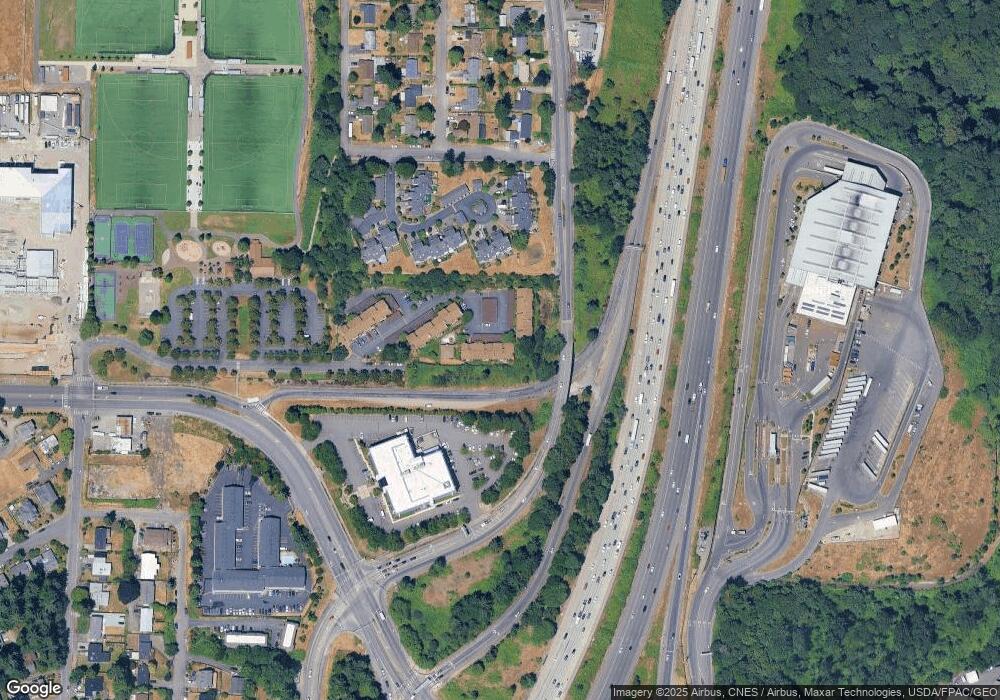
Map
Nearby Homes
- 4806 S 187th Place Unit A202
- 4802 S 187th Place Unit A106
- 18256 45th Ave S
- 17916 Military Rd S
- 4359 S 179th St
- 4016 S 186th St
- 17732 46th Ave S
- 19605 Military Rd S
- 18320 35th Place S Unit 384
- 18200 36th Ave S Unit 395
- 3517 S 192nd St
- 18318 35th Ave S Unit 368
- 18306 35th Ave S Unit 365
- 18306 35th Ave S
- 3439 S 181st Place Unit 146
- 3439 S 181st Place
- 18054 36th Ave S Unit 386
- 3420 S 182nd Place Unit 209
- 18305 35th Ave S Unit 357
- 3315 S 188th St
- 4822 S 187th Place Unit B102
- 4822 S 187th Place Unit C101
- 4822 S 187th Place Unit B203
- 4820 S 187th Place Unit C203
- 4818 S 187th Place Unit C105
- 4826 S 187th Place Unit D306
- 4826 S 187th Place Unit D305
- 4826 S 187th Place Unit D106
- 4828 S 187th Place Unit D203
- 4830 S 187th Place Unit D-301
- 4830 S 187th Place Unit D202
- 4830 S 187th Place Unit D302
- 4810 S 187th Place Unit B306
- 4810 S 187th Place Unit B206
- 4810 S 187th Place Unit B-305
- 4812 S 187th Place Unit B204
- 4812 S 187th Place Unit B203
- 4812 S 187th Place Unit B104
- 4814 S 187th Place Unit B201
- 18637 48th Place S