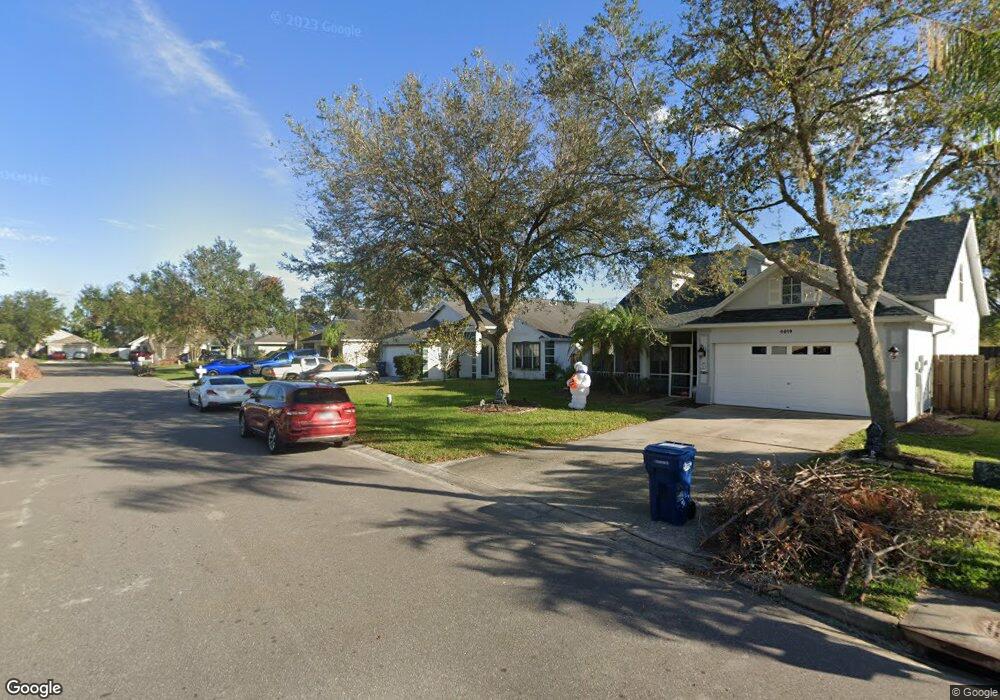
4823 69th Ct E Palmetto, FL 34221
West Ellenton NeighborhoodEstimated Value: $314,254 - $359,000
3
Beds
2
Baths
1,501
Sq Ft
$226/Sq Ft
Est. Value
About This Home
This home is located at 4823 69th Ct E, Palmetto, FL 34221 and is currently estimated at $339,564, approximately $226 per square foot. 4823 69th Ct E is a home located in Manatee County with nearby schools including Virgil Mills Elementary School, Buffalo Creek Middle School, and Palmetto High School.
Ownership History
Date
Name
Owned For
Owner Type
Purchase Details
Closed on
Jan 30, 2010
Sold by
Bailey Edward and Bailey Sierra L
Bought by
Bailey Edward and Bailey Xtavia
Current Estimated Value
Home Financials for this Owner
Home Financials are based on the most recent Mortgage that was taken out on this home.
Original Mortgage
$122,208
Interest Rate
4.97%
Mortgage Type
VA
Purchase Details
Closed on
Aug 30, 2002
Sold by
Levita Samuel J and Levita Nicole L
Bought by
Bailey Edward A and Bailey Sierra L
Home Financials for this Owner
Home Financials are based on the most recent Mortgage that was taken out on this home.
Original Mortgage
$127,575
Interest Rate
6.31%
Mortgage Type
VA
Purchase Details
Closed on
Mar 11, 1999
Sold by
Trebor Dev Corp
Bought by
Levita Samuel J and Levita Nicole L
Home Financials for this Owner
Home Financials are based on the most recent Mortgage that was taken out on this home.
Original Mortgage
$100,069
Interest Rate
6.73%
Mortgage Type
FHA
Create a Home Valuation Report for This Property
The Home Valuation Report is an in-depth analysis detailing your home's value as well as a comparison with similar homes in the area
Home Values in the Area
Average Home Value in this Area
Purchase History
| Date | Buyer | Sale Price | Title Company |
|---|---|---|---|
| Bailey Edward | -- | North American Title Company | |
| Bailey Edward A | $140,000 | -- | |
| Levita Samuel J | $18,000 | -- |
Source: Public Records
Mortgage History
| Date | Status | Borrower | Loan Amount |
|---|---|---|---|
| Previous Owner | Bailey Edward | $122,208 | |
| Previous Owner | Bailey Edward A | $127,575 | |
| Previous Owner | Levita Samuel J | $100,069 |
Source: Public Records
Tax History
| Year | Tax Paid | Tax Assessment Tax Assessment Total Assessment is a certain percentage of the fair market value that is determined by local assessors to be the total taxable value of land and additions on the property. | Land | Improvement |
|---|---|---|---|---|
| 2025 | $3,747 | $269,540 | -- | -- |
| 2023 | $3,747 | $295,108 | $35,700 | $259,408 |
| 2022 | $3,380 | $258,441 | $35,000 | $223,441 |
| 2021 | $2,733 | $184,099 | $35,000 | $149,099 |
| 2020 | $2,634 | $168,603 | $25,000 | $143,603 |
| 2019 | $2,528 | $164,721 | $25,000 | $139,721 |
| 2018 | $2,391 | $156,998 | $22,500 | $134,498 |
| 2017 | $2,130 | $150,659 | $0 | $0 |
| 2016 | $1,989 | $136,766 | $0 | $0 |
Source: Public Records
Map
Nearby Homes
- 4247 70th Street Cir E
- 4240 70th Street Cir E
- 5204 69th St E
- 7170 50th Avenue Cir E
- 5014 72nd St E
- 7162 50th Avenue Cir E
- 6314 Distant Haze Place
- 5202 72nd St E
- 39 East Rd
- 6443 Kenava Loop
- 6710 36th Ave E Unit 57
- 6710 36th Ave E Unit 103
- 6710 36th Ave E Unit 54
- 6710 36th Ave E Unit 34
- 6710 36th Ave E Unit 348
- 6710 36th Ave E Unit 337
- 6710 36th Ave E Unit 114
- 6710 36th Ave E Unit 104
- 6710 36th Ave E Unit 241
- 6710 36th Ave E Unit 322
Your Personal Tour Guide
Ask me questions while you tour the home.