


4823 Fieldbrook Ln Unit 24 Cypress, CA 90630
Estimated payment $5,179/month
Highlights
- Community Pool
- Laundry Room
- 2 Car Garage
- A.E. Arnold Elementary School Rated A
- Central Heating and Cooling System
About This Home
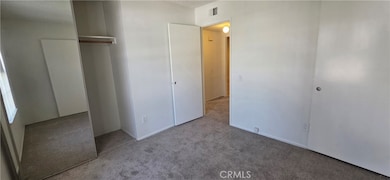
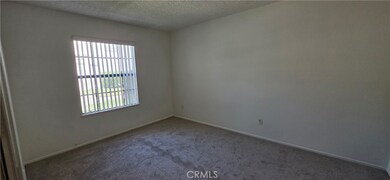
Single-level 3-bedroom, 2-bath condominium located in the Townhomes of Cypress community. This 1,296 sq ft home features a spacious living and dining area, an open kitchen with breakfast bar, indoor laundry room, and a private patio. The primary suite includes a dressing area, walk-in shower, and separate toilet room. Additional features include central air and heat and a detached two-car garage. Located within the Cypress School District with access to highly rated schools. Close to shopping, dining, parks, and other local amenities.
Listing Agent
Advantage Property Finance Group Brokerage Phone: 7149073846 License #02078575 Listed on: 07/10/2025
Property Details
Home Type
- Condominium
Year Built
- Built in 1978
Lot Details
- Two or More Common Walls
- Density is up to 1 Unit/Acre
HOA Fees
- $490 Monthly HOA Fees
Parking
- 2 Car Garage
- Parking Available
Home Design
- Entry on the 1st floor
Interior Spaces
- 1,296 Sq Ft Home
- 1-Story Property
- Living Room with Fireplace
Bedrooms and Bathrooms
- 3 Bedrooms | 2 Main Level Bedrooms
- 2 Full Bathrooms
Laundry
- Laundry Room
- Washer Hookup
Utilities
- Central Heating and Cooling System
Listing and Financial Details
- Tax Lot 279
- Tax Tract Number 9624
- Assessor Parcel Number 93568024
- $387 per year additional tax assessments
Community Details
Overview
- 79 Units
- Influential Townhomes Association, Phone Number (949) 668-0800
- La Perla Property Mgmt HOA
Recreation
- Community Pool
Map
Home Values in the Area
Average Home Value in this Area
Tax History
| Year | Tax Paid | Tax Assessment Tax Assessment Total Assessment is a certain percentage of the fair market value that is determined by local assessors to be the total taxable value of land and additions on the property. | Land | Improvement |
|---|---|---|---|---|
| 2025 | $8,295 | $742,845 | $623,662 | $119,183 |
| 2024 | $8,295 | $728,280 | $611,433 | $116,847 |
| 2023 | $8,107 | $714,000 | $599,444 | $114,556 |
| 2022 | $2,439 | $189,855 | $69,132 | $120,723 |
| 2021 | $2,407 | $186,133 | $67,777 | $118,356 |
| 2020 | $2,396 | $184,225 | $67,082 | $117,143 |
| 2019 | $2,335 | $180,613 | $65,766 | $114,847 |
| 2018 | $2,305 | $177,072 | $64,476 | $112,596 |
| 2017 | $2,231 | $173,600 | $63,211 | $110,389 |
| 2016 | $2,211 | $170,197 | $61,972 | $108,225 |
| 2015 | $2,194 | $167,641 | $61,041 | $106,600 |
| 2014 | $2,085 | $164,358 | $59,846 | $104,512 |
Property History
| Date | Event | Price | List to Sale | Price per Sq Ft |
|---|---|---|---|---|
| 07/10/2025 07/10/25 | For Sale | $760,000 | 0.0% | $586 / Sq Ft |
| 04/06/2017 04/06/17 | Rented | $2,300 | 0.0% | -- |
| 03/06/2017 03/06/17 | For Rent | $2,300 | -- | -- |
Purchase History
| Date | Type | Sale Price | Title Company |
|---|---|---|---|
| Gift Deed | -- | None Listed On Document | |
| Interfamily Deed Transfer | -- | -- |
Source: California Regional Multiple Listing Service (CRMLS)
MLS Number: PW25150790
APN: 935-680-24
Disclaimer: Certain information contained herein is derived from information provided by parties other than Homes.com. All information provided is deemed reliable, but is not guaranteed to be accurate and should be independently verified.
![]() The multiple listing data appearing on this website, or contained in reports produced therefrom, is owned and copyrighted by California Regional Multiple Listing Service, Inc. ("CRMLS") and is protected by all applicable copyright laws. Information provided is for viewer's personal, non-commercial use and may not be used for any purpose other than to identify prospective properties the viewer may be interested in purchasing. All listing data, including but not limited to square footage and lot size is believed to be accurate, but the listing Agent, listing Broker and CRMLS and its affiliates do not warrant or guarantee such accuracy. The viewer should independently verify the listed data prior to making any decisions based on such information by personal inspection and/or contacting a real estate professional.
The multiple listing data appearing on this website, or contained in reports produced therefrom, is owned and copyrighted by California Regional Multiple Listing Service, Inc. ("CRMLS") and is protected by all applicable copyright laws. Information provided is for viewer's personal, non-commercial use and may not be used for any purpose other than to identify prospective properties the viewer may be interested in purchasing. All listing data, including but not limited to square footage and lot size is believed to be accurate, but the listing Agent, listing Broker and CRMLS and its affiliates do not warrant or guarantee such accuracy. The viewer should independently verify the listed data prior to making any decisions based on such information by personal inspection and/or contacting a real estate professional.
Based on information from California Regional Multiple Listing Service, Inc. and /or other sources. All data, including all measurements and calculations of area, is obtained from various sources and has not been, and will not be, verified by broker or MLS. All information should be independently reviewed and verified for accuracy. Properties may or may not be listed by the office/agent presenting the information
- 9051 Cobblestone Ln Unit 40
- 4617 Alekona Ct
- 9122 Windsor Cir
- 8742 La Salle St
- 5000 Clementine Ln
- 6007 Clementine Ln Unit 21
- 9001 Cerise Ln Unit 109
- 9001 Cerise Ln Unit 113
- Plan A1 at Citrus Square - Cerise
- Plan A2 at Citrus Square - Cerise
- 4790 Montefino Dr
- 9011 Cerise Ln Unit 122
- 5275 Vista Real
- 8606 Belmont St
- 4891 Grace Ave
- 9080 Bloomfield Ave Unit 31
- 9080 Bloomfield Ave Unit 237
- 9080 Bloomfield Ave Unit 223
- 9080 Bloomfield Ave Unit 79
- 9080 Bloomfield Ave Unit 126
- 4662 Lincoln Ave
- 9179 Esther St
- 8871 Belmont St
- 9029 Kimberly Ln
- 4550 Lincoln Ave
- 9090 Moody St
- 5120 Lincoln Ave
- 4455 Casa Grande Cir
- 9021 Grindlay St
- 5091 New Mexico Ln
- 5271 Bishop St Unit B
- 5292 Bishop St
- 8561 Belmont St Unit 5
- 8561 Belmont St Unit 8
- 8561 Belmont St Unit 7
- 5424 Camp St
- 8411 Meadowlark Ln Unit B
- 5052 Canterbury Dr
- 9658 Oakmount St
- 21418 Bloomfield Ave
